NIFTY closes at highest level of the trading range... it has marginally closed above the recent swing high.
Option writing points to support at 6000 and resistance at 6500 this series. This implies possible bullishness.
On a bearish note, the VIX shot up today by 8%... this indicates increasing fear amongst option writers and has the effect of making options more expensive.

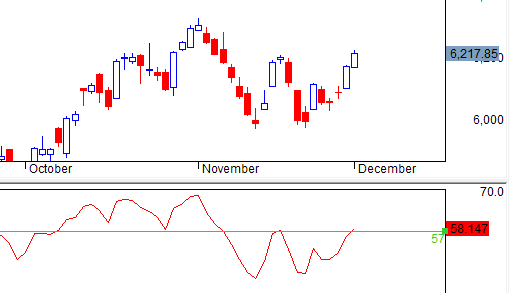
NIFTY is also at RSI resistance... let us see what happens here
Intraday chart points to rangebound trading....

Option writing points to support at 6000 and resistance at 6500 this series. This implies possible bullishness.
On a bearish note, the VIX shot up today by 8%... this indicates increasing fear amongst option writers and has the effect of making options more expensive.
NIFTY is also at RSI resistance... let us see what happens here
Intraday chart points to rangebound trading....
Hello Sir , How r u. sir can u please explain in details about VIX and its effect in NIFTY and option . what is relation between VIX and nifty/option . According to my knowledge when VIX increase it means a big movement is possible in NIFTY .
ReplyDeleteVIX is calculated by the exchange based on option prices... it roughly indicates the fear factor. Higher the VIX, greater the fear...
DeleteHi kpl,
ReplyDeleteThis is my first time on this blog. Really appreciate the wonderful work which you are coming up with.
Got the link from ST's blog. Could you tell how to know which strike price's options have been bought or written?? And also what is the significance??
An option cannot be written without a buyer... so for every trade, there is a writer and buyer.
DeleteWhat you have to look at are the option strike prices with highest open interest... you will get this info from the NSE website
Sir
ReplyDeleteIs Nifty making a bearish bat pattern.
If so point d is yet to form between now and the previous top.
If this is true a reversal sign between 80 to 90 percent of the rally from 6343 to 5972 around 6270 80 should be a good opprtunity to short
Also means some more upside from here.
Any views on this sir
bearish bat? don't know.
DeleteMarket is anyway rangebound so let's see.
Sir good evening ,sir your above updates r of spot or nifty futures and i could not understand NIFTY is also at RSI resistance , kindly update thnx
ReplyDeleteEOD chart is for nifty spot... intraday chart is for futures.
DeleteRef NIFTY chart with RSI in lower pane.... it is getting resisted at 57.
dear sir, pls. let us know how to get access rapidshare website.waiting your reply.thanks
ReplyDeletedear sir i am very impressive of your analyisis still i am new in market as trader willyou please guide me about hedging with simple eg. what should be my hedging policy if i purchase one lot of m& m in fut. against my purchase how should i protect loss if market falls, i hope you will do needfull.thanks.
ReplyDeleteFollowing a stoploss will be better than attempting a hedge... the latter is useful when your portfolio is in crores and you want to hold a trade for months.
Deletegud after noon sir i am chandan i am a new trader in nifty option please guide me sir. is this right time to buy CALL which is near of Spot Nifty ?
ReplyDeleteCannot advise on futures/ options because of the nature of the market... you can follow the posts here and develop your own strategy.
Delete