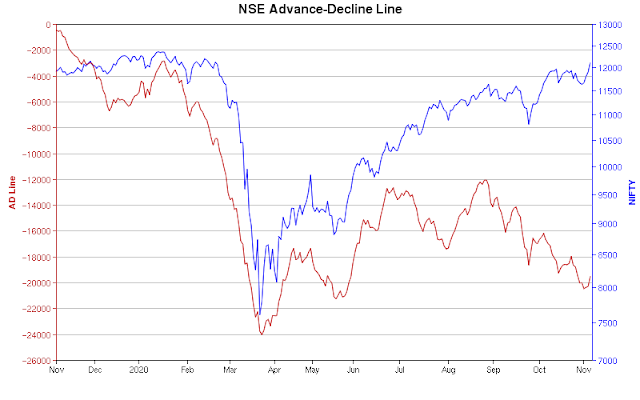
November 27, 2020

Trader's query on day trading, managing emotions

Dear KPL Sir,

I introduce myself as a fellow junior trader who has been doing swing trading for the last 2-3 years. I track days high and low along with OI and take positions only in index Future. Been a win some and lose some trader and have always kept my size and SL under check hence not blown aways my capital till date.... thankfully. Every expiry brings something new to learn and understand.

I follow your website and articles regularly but not a member of your forum as I do not have much to contribute in this initial journey except to observe as much as possible. 

I am approaching you for small guidance actually. I started day trading around Jan this year and have realised that this involves huge emotional capital which is very difficult for normal human beings like me (not made big losses but no big profits either till now in intra day) and was looking for a system based trade for index and checked the KPL swing system that you have on your website. 

Request you if you can help in understanding if I can start using this indicator in 5 min/15 min time frame for intra day trades. Since you do show this indicator on your website and have been using this since long, can you pl guide me in understanding if I too can follow this system blindly and be profitable. I am looking to follow a system which takes out my emotions and discretion from trades and more importantly be profitable.

Just to let you know, I do not use Amibroker as yet and trade out of the trading terminal only.

Thanks for your guidance and being a helpful trader in the community.

Answer

NIFTY intraday charts

5 min:


NIFTY EOD charts

- trend is up on daily charts
- today nifty closed flat at 12969
- AD was 2:1

- weekly charts are likely to show a doji
- swing low 12700
- support 12500

- Monday is a trading holiday 


November 26, 2020

NIFTY intraday charts

5 min:


15 min:

NIFTY EOD chart

- trend is up on daily chart
- today nifty closed 1% in positive at 12987
- AD was 2:1

- VIX dropped 13% to 20

- yesterday's red bar had no follow thru selling
- this was along expected lines

- region of 12500-12700 to provide very good support


November 25, 2020

NIFTY intraday charts

5 min:


NIFTY EOD chart

- trend is up on daily charts
- today nifty opened gapup but closed 1.5% in negative at 12858
- in the process, a huge engulfing bar was formed.
- this has happened few times in the past but it led to no further correction

- AD was 1:2 (not bad)
- VIX shot up 10% to 23

- negative divergence on RSI chart

- swing low 12700
- support 12500-12000


November 24, 2020

NIFTY RSI chart

- nifty has made a new high but RSI has not as yet
- negative divergence to kick in if 12700 breaks

- google for more info on RSI


NIFTY intraday charts

5 min:


NIFTY EOD charts

- trend is up on daily charts
- today nifty closed 1% in positive at 13055
- this is the first ever close above 13000
- AD was 11:8

- swing low around 12700


November 19, 2020

NIFTY intraday charts

5 min:


NIFTY EOD charts

- trend is up on daily charts
- today nifty closed 1.3% in negative at 12772
- AD was 4:5

- resistance around 13000... big round number
- support 12500

- banknifty also reversed from 30000... big round number


Expanding wedge on S&P 500 weekly charts


November 18, 2020

NIFTY intraday charts

5min:


NIFY EOD charts

- trend is up on daily charts
- today nifty closed 0.5% in positive at 12938
- AD was 5:4

- swing support / SL 12500

- next resistance 13500


November 17, 2020

NIFTY intraday charts

5 min:

NIFTY EOD charts

- trend is up on daily charts
- today nifty closed 1.2 % in positive at 12874 
- change is 0.74% positive compared to Muharat trading session which I do not track

- AD was 5:4

- NIFTY PE ratio at 34 +


100 year audit relationships


November 15, 2020

4 signs of possible top out in market


November 13, 2020

NIFTY EOD charts

- trend is up on daily charts
- today markets closed 0.2% in positive at 12720
- AD was 3:2

- triangle movement seen (last 3 days)
- so consolidation happening

- till 12500 breaks, nothing to worry


November 12, 2020

NIFTY EOD charts

- trend is up on daily charts
- today nifty closed o.5% in red at 12691
- AD was 3:2 (good)

- sideways movement likely for few days to 2 weeks

- support 12000


NIFTY hourly charts

- after a huge rally, markets are consolidating
- this process can take few days to 2 weeks

- supports will develop during this period
- right now 12600 looks like a good support

- note breakout level of 12000 should ideally be tested at least once


November 11, 2020

NIFTY EOD charts

- trend is up on daily charts
- today nifty closed 0.9% in positive at 12749

- AD was 5:4

- rally has been very strong with 7 consecutive green bars and
- 6 gap ups

- 2 hanging man bars formed
- but till we have a break below 12500 I will not be worried

- nifty is up almost up 10% this month
- a consolidation of 1-2 weeks cannot be ruled out


November 10, 2020

NIFTY intraday charts

5 min:


INDIAVIX charts... for reference only


NIFTY EOD charts

- trend is up on daily charts
- today nifty closed 1.4% in positive at 12631

- today is 5th gap up

- AD was 4:5... not good
- midcaps were flat and smallcaps closed slightly in the red

- VIX up 7% to 21.6
- NIFTY PE ratio 34

- BANKNIFTY up 20% this month versus 7% NIFTY


November 9, 2020

Stocks at 52 week high

 ADANIENT

ADANIENT chart

NIFTY intraday charts

 15 min:

NIFTY EOD charts

- nifty closed 1.6% in positive at 12461
- this is highest ever close

- AD was 3:2

- trend remains strongly up
- nothing to worry as long as 12000 does not break


BANKNIFTY breakout

 - next resistance 28000-30000


November 6, 2020

NIFTY intraday charts


NIFTY EOD charts

- trend is up on daily charts
- today nifty closed 1/2% in positive at 12263
- AD was 3:2

- option writers feel 12000 will not break this series
- swing low 11500


You can be right about market direction but still not make money


NSE advance decline chart


November 5, 2020

CNX 500 index nearing resistance


NIFTY intraday charts


NIFTY EOD chart

- new buy signal today
- the previous buy signal got stoplossed
- the current buy signal will get stoplossed if nifty closed below 5 or 10 bar low (your choice)
- swing low 11500.... good support

- today nifty closed 1.8% in positive at 12120
- AD was healthy at 3:1
- VIX dropped 10% to 21

- note we had lot of big red bars from 12000 levels
- this was indicative of large selling
- now that 12000 is taken out, it should offer support

- note complete reversal of today's gains and closed below 12000 will 
- lead to formation of pin bar


November 4, 2020

NIFTY intraday charts

- staying away from markets this week


NIFTY EOD charts

- nifty closed 0.8% in positive at 11908
- AD was flat

- VIX down 4% to 23

- good support at 11500, resistance at 12000

- BNF was earlier underperforming the nifty, now it is trading above AUG/SEP swing high


The Ideal Company Doesn’t Pay A Dividend

....You in my view you should never invest in equities for income. You should invest in equities for the greatest total return that you can get. So that’s the growth of the share price plus any income and if you need to spend some money sell some of your holdings, which I know isn’t rational to some people but I assure you is the correct way to do this.

The ideal company doesn’t pay a dividend and if a company can make a 30% return on capital why would you want it to pay you a dividend? You by and large can’t make a 30% return on capital so you want it to retain the earnings and generate that return for you.

November 3, 2020

NIFTY hourly charts

- selling pressure near 12000
- red bars are bigger than green bars


NIFTY EOD charts

- today nifty closed 1.2% in positive at 11813
- AD was 5:4

- as long as 11500 holds, nothing to worry
- resistance 12000


BANKNIFTY breakout

EOD charts:


Hourly chart:


10 signs the bubble has already popped

 All the signs of a bubble are there, including:

  1. an IPO mania;
  2. extraordinary valuations and new metrics for valuation;
  3. a huge market concentration in a single sector and a few stocks;
  4. a second tier of stocks that most people haven’t heard of at S&P 500-type market
    capitalizations;
  5. the more fanciful and distant the narrative, it seems the better the stock performs;
  6. outperformance of companies suspected of fraud based on the consensus belief that
    there is no enforcement risk, without which crime pays;
  7. outsized reaction to economically irrelevant stock splits;
  8. increased participation of retail investors, who appear focused on the bestperforming names;
  9. incredible trading volumes in speculative instruments like weekly call options and
    worthless common stock; and
  10. a parabolic ascent toward a top

Read more at https://acquirersmultiple.com/2020/10/david-einhorn-10-signs-the-bubble-has-already-popped/

November 2, 2020

NIFTY EOD charts

- nifty closed 0.2% in positive at 11669
- AD was 7:11

- trading range was extremely narrow

- RELIANCE, an index heavyweight, tanked 9% today
- this stock has 14% weight in nifty
- if this stock was flat, then nifty would have been up by 260+ points
- but nifty did not tank as HDFC and other heavyweights were up.

- you can use the  nifty replica calculator and play around with different what if scenarios


Share this...