
July 7, 2021
July 5, 2021


July 2, 2021


NIFTY EOD chart
- nifty trend remains up

- broader market remains sideways
- swing low is around 15500

June 30, 2021
NIFTY intraday chart
- today nifty closed flat at 1571


- AD was also flat
- banknifty was weak
- today was a nice trending day for price action traders and indicator followers
- here are 2 charts... take your pick

and this one with kplswing indicator

June 28, 2021
NIFTY intraday chart
- nifty opened gap up but sold off immediately

- intraday fall was not much and support started coming in at lower levels
- this is actually bullish for the markets
- tomorrow, key levels to watch would be 15830 and 15930 F

NIFTY EOD charts
- nifty closed marginally in the red at 15815

- AD was flat
- lot of tussle happening around 16000
- this will be an area of resistance
- support 15500

June 25, 2021

NIFTY EOD charts
- trend is up on daily charts

- today nifty closed 0.4% in positive at 15860
- AD was flat....some problem with NSE data/ probably corrupted
- swing low/ support 15500
- resistance 16000
- VIX drops 11%

June 24, 2021

NIFTY EOD charts
- nifty closed 0.7% in positive at 15790

- AD was 2:3
- trend remains clearly up
- support 15500
- stiff resistance around 16000
- option data shows limited upside this week

Change in blog newsletter provider
Feedburner has informed me that they will be discontinuing the email newsletter service for all blogs.
I have accordingly signed up with follow.it
Sign up takes under less than a minute.
Visit https://follow.it/vfmdirect to subscribe
June 23, 2021
NIFTY EOD charts
- trend is up on daily charts

- today nifty closed 0.5% in negative at 15867
- AD was 1:2
- some loss of momentum seen
- after the big green candle of 21-JUN, markets should have moved faster up.
- this has not happened.
- in fact, we are seeing selling for past 2 days
- support 15500

June 21, 2021
NIFTY EOD charts
- nifty opened gap down around 15500 and closed 0.4% in positive at 15746

- price action of last 2 days shows tremendous support around 15500
- this level can now be considered as a good swing low
- trend remains firmly up.


June 18, 2021
NIFTY EOD charts
- nifty closed flat at 15683

- AD was 1:2
- intraday volatility was huge with a fall of 250 points followed by similar recovery
- markets reversed from 15400-15500 levels
- this was FEB 2021 peak and is now an important support
- break of this level anytime next 1-2 weeks will indicate trend reversal.

NIFTY intraday charts
5 min charts:
- highlighted range refers to prev day high low.


- open was a red bar near prev day high
- there were multiple sell signals at 15700 F and 15625 F
- these are marked as arrows
- buy signal was on close above 15600 F
- next week, 15750 F is an important resistance
- sustaining above this will be bullish

Intraday action is more clear on 3 min charts

- Hourly charts show why markets took support at 15450 spot
- this level was incidentally the top in FEB 2021

June 17, 2021
NIFTY intraday charts
- despite a gap down opening, nifty recovered smartly and rallied

Hourly chart:

- resistance was at previous day low 15770 F
- this was an area of a safe short trade
- another short trade was at 2nd arrow
- cover on trailing
- net close was 0.5% in negative at 15691 spot
- note support at 15500-15600 spot
- AD was 1:2


June 16, 2021
NIFTY intraday charts
- nifty closed 0.6% in negative at 15768 spot

- AD was 1:2
- prev day low provided support on open (15580 F)
- this level broke and later on provided resistance
- day's low 15770 F
- key levels for tomorrow are 15770-15580 F
- on hourly charts, next support is around 15600

June 14, 2021

NIFTY intraday charts
5 min:

- today nifty opened gap down and lost almost 200 points in 30 minutes
- recovery from 15600 levels was fast
- close was finally near prev day high ie. 15840 F
- AD was 4:5

June 13, 2021
June 10, 2021
NIFTY EOD charts
- nifty today closed 0.7% in positive at 15738

- AD was excellent at 3:1
- gains were substantial in nifty midcap and small cap indices
- overall structure is still bullish
- support around 15500
- resistance 16000

June 9, 2021

NIFTY EOD charts
- today nifty closed 0.70% in negative at 15635

- AD was 4:5
- note range compression in past few days
- volatility expansion happened today
- too early to know if this is a trend reversal
- immediate support at 15000-15300 range
- the sudden drop today is visible in intraday charts

May 31, 2021

NIFTY EOD charts
- nifty closes at all time high at 15583

- this is being done after more than 3 months
- last ATH was made on 16-FEB and since then markets have been in a range
- trend remains firmly up with no divergences as yet
- support 15000

May 29, 2021

May 28, 2021
NIFTY EOD charts
- nifty achieves highest ever close at 15436

- AD was negative at 2:3
- VIX dropped 13% to 17
- note series of extremely small bars in this rally
- this limits intraday opportunities while positional traders profit
- RELIANCE was up 6%...
- this heavyweight contributed 150+ points to nifty by itself

May 27, 2021

May 25, 2021
NIFTY EOD chart
- nifty closed flat at 15208

- AD was 5:4
- overall trend is up as long as markets hold above 15000
- swing low support around 14500

May 24, 2021

NIFTY EOD charts
- today nifty closed flat at 15198

- AD was 3:2
- so far index is holding very well above 15000
- as long as this does not break on closing basis, more upsides are possible
- only concern is the rising wedge
- right now I am not taking this seriously as SL of 15000 is very close

NIFTY PE ratio chart
- the nifty PE ratio hit a high of 42 in FEB this year

- it was 40 around last week of MAR
- it suddenly declined to 34 on 1st April and is falling since then
- it is currently around 30
- how this sudden (almost overnight drop)?

May 21, 2021

NIFTY EOD charts
- nifty closed 1.8% in positive at 15175


- AD was 3:2
- this close is impressive coming after a red bar the prev day
- a gap up next week will be strongly bullish
- ignoring the rising wedge right now

- kplswing indicator gives a buy (again)
- SL below 14880 on closing basis

May 20, 2021

NIFTY EOD charts
- nifty closed 0.8% in negative at 14906

- Incidentally there was a buy signal on kplswing indicator

- AD was flat
- so nifty could not sustain above 15000
- tomorrow is Friday so we will see if a weekly close happens above 15000 or not
- if markets continue down, then this would set up base for rising wedge
- in this case, break of lower trendline can lead to a bigger correction

- this has failed today

May 19, 2021
NIFTY EOD charts
- nifty closed 0.5% in negative at 15030

- AD was 5:4
- note 15000 provided resistance earlier
- this level should now provide support
- rising wedge seen
- for further bullishness, nifty must cross 15150 with speed
- failure to cross upper trendline can make bulls uncomfortable
- break of lower trendline will be confirmation of further bearishness
- note triangles are very difficult to trade

May 18, 2021
NIFTY EOD charts
- nifty closed 1.3% in positive at 15108
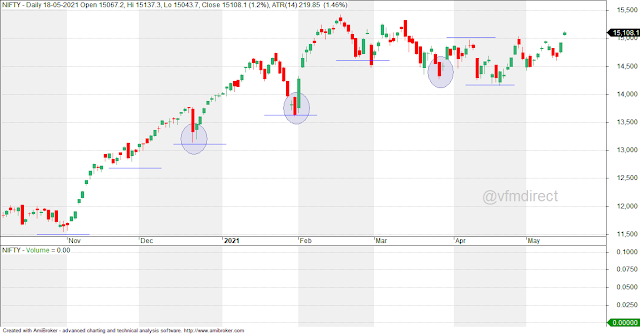
- AD was 3:2
- trading range was small with most of the gains going to positional traders
- note this is the first close this month above 15000
- in April, nifty never closed above 15000
- now swing low support is at 14500
- till this breaks, nothing to worry

May 17, 2021
NIFTY intraday charts
- breakout above PDH 14750 F was very bullish

- support shifted from 14750 to 14850 F
- minor support at 14900 F


Subscribe to:
Posts (Atom)