- These charts are for educational purposes only.
- This is not a recommendation to buy or sell
- Follow the trend... if stock is at 20 days high, trend is up and vice versa.
- Golden stoploss: min 10% or 20 days low (long position).
- Never risk more than 1% of your capital on any trade.
- All charts are provided by icharts.in
December 31, 2014
Stock charts
Market outlook
Trend is down and will reverse on close above 8630 spot.
The recent corrective rally has so failed to cross 61.8% retracement level. Now we have formation of swing low at 7960 and swing high at 8365 levels (all spot). Since markets are almost at halfway levels and considering that both support and resistance are nearby, it might make sense not to do anything unless you are a daytrader .... writing this from 4-5 days and so far nothing is happening - only broker earning.
Option writing points to support at 8000 levels. This might mean limited downsides from current levels.
December 30, 2014
Stock charts
- These charts are for educational purposes only.
- This is not a recommendation to buy or sell
- Follow the trend... if stock is at 20 days high, trend is up and vice versa.
- Golden stoploss: min 10% or 20 days low (long position).
- Never risk more than 1% of your capital on any trade.
- All charts are provided by icharts.in
Market outlook
Trend is down and will reverse on close above 8630 spot.
The recent corrective rally has so failed to cross 61.8% retracement level. Now we have formation of swing low at 7960 and swing high at 8365 levels (all spot). Since markets are almost at halfway levels and considering that both support and resistance are nearby, it might make sense not to do anything unless you are a daytrader .... writing this from 3-4 days and so far nothing is happening - only broker earning.
Option writing points to support at 8000 levels. This might mean limited downsides from current levels.
December 29, 2014
Stock charts
- These charts are for educational purposes only.
- This is not a recommendation to buy or sell
- Follow the trend... if stock is at 20 days high, trend is up and vice versa.
- Golden stoploss: min 10% or 20 days low (long position).
- Never risk more than 1% of your capital on any trade.
- All charts are provided by icharts.in
Market outlook
Trend is down and will reverse on close above 8630 spot.
The recent corrective rally has so failed to cross 61.8% retracement level. Now we have formation of swing low at 7960 and swing high at 8365 levels (all spot). Since markets are almost at halfway levels and considering that both support and resistance are nearby, it might make sense not to do anything unless you are a daytrader.
Option writing points to support at 8000 levels. This might mean limited downsides from current levels.
December 27, 2014
Weekend update
Rally fails to cross 61.8% retracement and terminates at 8365 levels. Now we have formation of swing low at 7960 and swing high at 8365 levels (all spot). Since markets are almost at halfway levels and considering that both support and resistance are nearby, it might make sense not to do anything unless you are a daytrader.
Option writing points to support at 8000 levels. This might mean limited downsides from current levels.
Option writing points to support at 8000 levels. This might mean limited downsides from current levels.
December 25, 2014
BANK NIFTY technicals
This index has rallied the most and corrected the least.
Decision levels for long / short - 19000 / 18400 spot.
Chart is self explanatory.

Decision levels for long / short - 19000 / 18400 spot.
Chart is self explanatory.
December 24, 2014
Hot stocks and charts
- These charts are for educational purposes only.
- This is not a recommendation to buy or sell
- Follow the trend... if stock is at 20 days high, trend is up and vice versa.
- Golden stoploss: min 10% or 20 days low (long position).
- Never risk more than 1% of your capital on any trade.
- All charts are provided by icharts.in
Market outlook
Trend is down and will reverse on close above 8630 spot.
Within this downtrend we have a rally which may have fizzled out. This is now setting support (swing low) at 8000 and resistance (swing high) at 8400.
Within this range, it makes sense to do nothing unless you are a daytrader.
Option writing points to support at 8000 and resistance at 8400 (JAN series).
.png)
MCX GOLD charts
Monthly charts: trend will turn down on close below 25000. Note that in USD, the trend is already down for quite some time but is not showing in INR because of currency fluctuations and customs/ duties etc.
.png)
December 23, 2014
Market outlook
Trend is down and will reverse on close above 8630 spot.
Within this downtrend, markets formed higher high higher low formation for 4 days. Today's close was however below yesterday's close and deep into previous day's candlestick body.
Various possibilities exist at this stage... one is just a pause in this rally or possible formation of a lower swing high. In case of latter, it can mean a double bottom at 8000 levels (+/- 50 points) followed by a rally OR break of recent supports leading to new lows.
These possibilities are shown on the charts.
Percentage loss and rise to breakeven
A loss of 20% in a stock does not mean that this can be recovered if the stock rallies 20%.. the stock must move by 25% then you are at breakeven.

Similarly a 50% erosion in a stock requires a 100% gain for a breakeven.
Think it over.
December 22, 2014
Hot stocks and charts
- These charts are for educational purposes only.
- This is not a recommendation to buy or sell
- Follow the trend... if stock is at 20 days high, trend is up and vice versa.
- Golden stoploss: min 10% or 20 days low (long position).
- Never risk more than 1% of your capital on any trade.
- All charts are provided by icharts.in
Market outlook
Trend is down and will reverse on close above 8630 spot.
Within this trend which is down (on daily charts), we have bullishness on hourly charts. This will reverse on close below 8200.
Note that markets close nicely in the positive, the advance decline has not been encouraging - it is roughly at 800-600.
Within this trend which is down (on daily charts), we have bullishness on hourly charts. This will reverse on close below 8200.
Note that markets close nicely in the positive, the advance decline has not been encouraging - it is roughly at 800-600.
Probability and stock markets
Something as simple as high school maths can have a dramatic impact on your trading.
A trader's current views of probability could be completely wrong, and they could very well be why they are not making money in the markets.
A trader's current views of probability could be completely wrong, and they could very well be why they are not making money in the markets.
December 20, 2014
The Fed NEEDS Inflation Otherwise the Bond Bubble Will Burst
As we keep emphasizing, the Fed’s real concern is the bond bubble… NOT stocks.
We get more evidence of this from Janet Yellen’s press conference after the Fed’s Wednesday FOMC meeting.
During the conference, Yellen repeatedly stated that lower oil prices were “positive” for the US economy. This is simply astounding because the Fed has repeatedly told us time and again that it was IN-flation NOT DE-flation that was great for the economy.
And yet, on Wednesday, the head of the Fed admitted, in public, that deflation can in fact be positive.
How can deflation be both positive for the economy at the same time that the economy needs MORE inflation?
The answer is easy… Yellen doesn’t care about the economy. She cares about the US’s massive debt load AKA the BOND BUBBLE.
Read complete article hereFed calls time on $5.7 trillion of emerging market dollar debt
The US Federal Reserve has pulled the trigger. Emerging markets must now brace for their ordeal by fire.
They have collectively borrowed $5.7 trillion in US dollars, a currency they cannot print and do not control. This hard-currency debt has tripled in a decade, split between $3.1 trillion in bank loans and $2.6 trillion in bonds. It is comparable in scale and ratio-terms to any of the biggest cross-border lending sprees of the past two centuries.
BANK NIFTY technicals
This index looks the strongest amongst other indices.
However, trend is down and will reverse on close above 18900
.png)
However, trend is down and will reverse on close above 18900
CNX IT technicals
Trend is down and will on close above 12000.
Currently the index is trading near double bottom support at 10700.
Formation of lower swing high is expected.

Currently the index is trading near double bottom support at 10700.
Formation of lower swing high is expected.
Comparison of nifty, midcap and small cap charts
NIFTY trend is down and will reverse on close above 8630. Formation of lower swing high is expected.

December 19, 2014
Hot stocks and charts
- These charts are for educational purposes only.
- This is not a recommendation to buy or sell
- Follow the trend... if stock is at 20 days high, trend is up and vice versa.
- Golden stoploss: min 10% or 20 days low (long position).
- Never risk more than 1% of your capital on any trade.
- All charts are provided by icharts.in
Weekend update
Trend is down and will reverse on close above 8630 spot.
Within this downtrend, markets recovered smartly off oversold conditions... this was along expected lines.
Now within any trend, an anti-trend move of 2-3 days is allowable. So now we have 2 days of higher high higher lows and also 2 gaps to contend with.
Interestingly, today was a small bar implying selling at higher levels.
December 18, 2014
Hot stocks and charts
- These charts are for educational purposes only.
- This is not a recommendation to buy or sell
- Follow the trend... if stock is at 20 days high, trend is up and vice versa.
- Golden stoploss: min 10% or 20 days low (long position).
- Never risk more than 1% of your capital on any trade.
- All charts are provided by icharts.in
Market outlook
Trend is down and will reverse on close above 8630 spot.
Within this downtrend, markets recovered smartly off oversold conditions... this was along expected lines.
Yesterday's hammer was the first clue and condition for trading above yesterday's high was met on open itself.
Now within any trend, an anti-trend move of 2-3 days is allowable. Today was the first day so a rally for another day is perfectly fine.
December 17, 2014
Market outlook
Trend is down and will reverse on close above 8630 spot.
Today, markets formed a hammer... this has bullish implications if nifty can trade above today's high tomorrow.
Markets remain oversold as of now but in strongly trending (down) markets, this is normal. Let us if we get a bounce from current levels.
Today, markets formed a hammer... this has bullish implications if nifty can trade above today's high tomorrow.
Markets remain oversold as of now but in strongly trending (down) markets, this is normal. Let us if we get a bounce from current levels.
December 16, 2014
Market outlook
Trend is down and will reverse on close above 8630 spot.
Within this downtrend, markets have broken and closed below the support at 8180... this has also had the effect of creating an oversold condition on RSI charts.
The current close is almost at the 61.8% retracement level.
Option writing points to support at 8000.
Within this downtrend, markets have broken and closed below the support at 8180... this has also had the effect of creating an oversold condition on RSI charts.
The current close is almost at the 61.8% retracement level.
Option writing points to support at 8000.
December 15, 2014
Market outlook
Trend is down and will reverse on close above 8630 spot.
Within this downtrend, markets have taken support at 8180... this is along expected lines so no surprises here. What is important from here on is how the markets will behave from here on.
A small rally or time consuming rally will see formation of a lower swing high followed by new lows. Bullish contention will require a fast breakout above 8630 spot.
December 14, 2014
Some stocks which have not corrected at all
Some stocks which have not corrected at all... I am long in all of them.
My SL is 15-20 days low.
Do not consider this as a recommendation to buy or sell.
The reason of this post is to show that while markets are correcting, there are still a lot of stocks which are holding firm and doing well. They may correct later on or rally further but that is a different story.
My SL is 15-20 days low.
Do not consider this as a recommendation to buy or sell.
The reason of this post is to show that while markets are correcting, there are still a lot of stocks which are holding firm and doing well. They may correct later on or rally further but that is a different story.
BANK NIFTY technicals
Unlike the nifty which has broken its recent swing low, BNF trend is still up. It is actually looking strong compared to the nifty.
Expect more strength above 18600.

Expect more strength above 18600.
How many indicators should one use
Best indicator is no indicator..... I see pure price only... it tells everything you need to know.
All other indicators only add noise as they are derivatives of prices or are indicators of indicators.
But if you feel compelled to use one, then limit yourself to 1 indicator.
More indicators just complicate and are unlikely to add value.
Do not ever do this...

All other indicators only add noise as they are derivatives of prices or are indicators of indicators.
But if you feel compelled to use one, then limit yourself to 1 indicator.
More indicators just complicate and are unlikely to add value.
Do not ever do this...
December 13, 2014
The stone age did not end because of lack of stones
The stone age did not end because of lack of stones...
Similarly the oil age will not end because of lack of oil.

Similarly the oil age will not end because of lack of oil.
Interest rate cut
Past one year or more, everyone is expecting a rate cut from RBI so as to "boost" the economy.
The NIFTY in this period have rallied from 6000 levels to 8000+ levels without any rate cut.
So what will happen if the interest rate cut actually happens? Would an interest rate cut be considered a bullish indicator or a bearish one considering the fact that markets anyway blasted without a rate cut?
NIFTY Fibonacci chart
This is the fibonacci retracement chart for nifty... 50% retracement is at 8170 levels which is also the previous peak formed in SEP.

Weekend update
Markets close 3.7% in the red this week. I thought this would be the biggest weekly drop this year but I was wrong - markets had closed 3.8% in red in one week in JUL 2014 (shown in circle in chart). That time, nothing happened thereafter and markets continued their rally.
This time, I don't know if the same will happen - however we are very close to support at 8160 spot so let's see if market's bottom out here or not.
This time, I don't know if the same will happen - however we are very close to support at 8160 spot so let's see if market's bottom out here or not.


December 11, 2014
Hot stocks and charts
- These charts are for educational purposes only.
- This is not a recommendation to buy or sell
- Follow the trend... if stock is at 20 days high, trend is up and vice versa.
- Golden stoploss: min 10% or 20 days low (long position).
- Never risk more than 1% of your capital on any trade.
- All charts are provided by icharts.in
Markets close below 8300
My trend reversal level for nifty was 8300 spot and today markets closed below this level. Now I have to assume trend is down till nifty closes above 8630 spot.
I expect good support at 8160 spot levels.
Note that hourly charts gave a sell on close below 8500 and this is the level a futures trader should be looking at.
A word about 8300... there is nothing magical or sacrosanct about this level. Normally I take recent swing low as reversal level. In this case, the swing low was at 7700 and nothing above that till 8630. Since we need some SL I settled on 8300 as we had a cluster of supports here. So this 8300 is more of a support area and not a swing low level. Also, it does not matter in this case if the support is at 8280 or 8310.
If the trend has to turn down, whatever level you plot (eg. 8200 or 8400) has to eventually break... it may happen few days earlier or later.
December 10, 2014
Hot stocks and charts
- These charts are for educational purposes only.
- This is not a recommendation to buy or sell
- Follow the trend... if stock is at 20 days high, trend is up and vice versa.
- Golden stoploss: min 10% or 20 days low (long position).
- Never risk more than 1% of your capital on any trade.
- All charts are provided by icharts.in
Market outlook
Short term trend (hourly charts) is down ... EOD trend is still up and reverse on close below 8300 spot.
My swing indicator SL is 8300 (20 days low).
Those who like to focus on MA should note that 50DMA is 8210 spot.... this level is NOV month low.
Option writing is giving mixed clues... writers expect 8300 to break but they are not expecting a big fall. They also do not expect markets to cross 8600 in immediate future.
December 9, 2014
Hot stocks and charts
- These charts are for educational purposes only.
- This is not a recommendation to buy or sell
- Follow the trend... if stock is at 20 days high, trend is up and vice versa.
- Golden stoploss: min 10% or 20 days low (long position).
- Never risk more than 1% of your capital on any trade.
- All charts are provided by icharts.in
Market outlook
Faster retracement of rally hints at a bigger correction. While support at 8300 is not violated, the extent of fall in 2 days in comparison with the number of days required to rally means we are looking at a trend reversal.
Note that hourly charts gave a sell yesterday and 15 min charts gave a sell from 1-DEC.
Note that hourly charts gave a sell yesterday and 15 min charts gave a sell from 1-DEC.
December 8, 2014
Market outlook
Trend is up and will reverse on close below 8300.
Now last week's low was 8500 and a good support and today (first day of the week), markets sold off and closed below this support. So depending on your trading style, you may assume that trend has already reversed. If this is the case, then fine... your buy above level would be last week's high at
8630 spot (roughly).
Hourly charts have a clear sell...
December 7, 2014
CNX IT technicals
Current uptrend is weakening and the index has closed below the recent swing high / resistance at 11600.
The index also suffered its largest one day fall in past 20-30 days.
The index also suffered its largest one day fall in past 20-30 days.
December 6, 2014

December 5, 2014
BANK NIFTY technicals
BNF still trending up nicely.... no signs of any weakness.
Immediate support 17800.

Immediate support 17800.
Weekend update
Trend is up and will reverse on close below 8300.
I am also looking at trendline support as shown on the chart.
Option writing shows increasing support at 8500 and diminishing resistance at 8700 levels... this is a
bullish sign.
India VIX is almost at record lows... not a good sign as it indicates lack of any fear in markets.
I am also looking at trendline support as shown on the chart.
Option writing shows increasing support at 8500 and diminishing resistance at 8700 levels... this is a
bullish sign.
India VIX is almost at record lows... not a good sign as it indicates lack of any fear in markets.
December 4, 2014
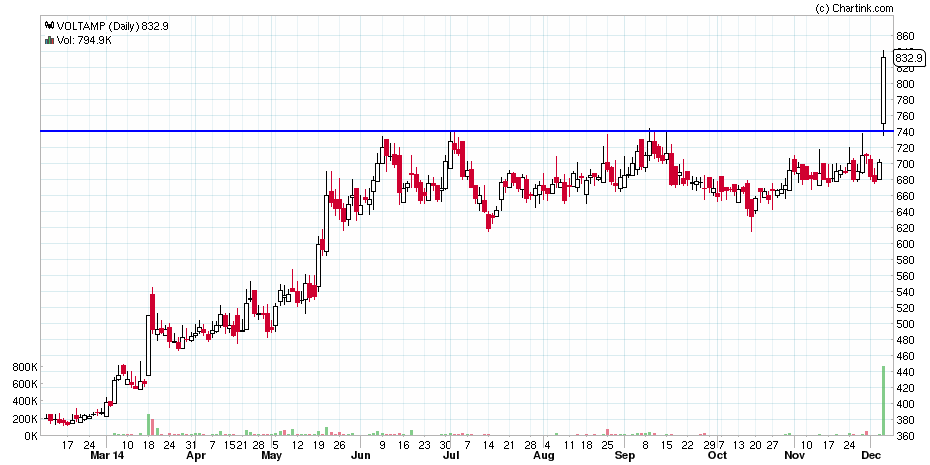
VOLTAMP breakout
VOLTAMP breakout... note that this is a low volume stock but I like the chart as an example of how a breakout should look.
The breakout level is 740 and since this level offered resistance in the past, it should now offer support.
Your SL will be below this level.
The breakout level is 740 and since this level offered resistance in the past, it should now offer support.
Your SL will be below this level.
Breakout in NIFTY JUNIOR index
NIFTY JUNIOR index has given another breakout... now this index (trending up) will reverse on close below 18200.

Market outlook
Trend is up and will reverse on close below 8300.
Signs of increasing volatility in the region between 8500 and 8650 spot.
I am also looking at trendline support as shown on the chart.
Option writing shows increasing support at 8500 and diminishing resistance at 8700 levels... this is a bullish sign.
Signs of increasing volatility in the region between 8500 and 8650 spot.
I am also looking at trendline support as shown on the chart.
Option writing shows increasing support at 8500 and diminishing resistance at 8700 levels... this is a bullish sign.
December 3, 2014
Market outlook
Trend is up and will reverse on close below 8300.
Today markets traded in a range and failed to give any directional breakout. Ideally it should have crossed yesterday's highs but since it has not, one should start becoming cautious.
Today markets traded in a range and failed to give any directional breakout. Ideally it should have crossed yesterday's highs but since it has not, one should start becoming cautious.
JETAIRWAYS breakout
Stock has given a strong breakout... the fundamental explanation is the rather substantial drop in crude prices which will substantially benefit an airline company as fuel accounts for large cost of its operations.
See the breakout ... 40% gain in less than 2 weeks.
See the breakout ... 40% gain in less than 2 weeks.
December 2, 2014
BANK NIFTY technicals
Breakout above 16200 is still strong with only a minor correction in between.
Consider trend as up with swing low support at 17800.

Consider trend as up with swing low support at 17800.
Market outlook
Trend is up and will reverse on close below 8300.
Today, markets closed in the red for the 2nd consecutive day. Within an uptrend, lower high lower low formation is allowable for 2-3 days after which prior trend must resume.
The nature of the fall looks like a correction and not a trend reversal. For a trend reversal, I will look at a faster retracement of the previous rally and so far this is elluding us.
Option writing is giving mixed clues... resistance at 8700 and support at 8500.
Small Cap index chart
This is a 2 year weekly chart... after giving a buy signal around 3400 levels. the index is now consolidating and trading in a range. Note that while is still making new highs, this index has not crossed JULY highs and is in fact correcting.
Support 4800... further bullishness above 5400 levels.
.png)
Support 4800... further bullishness above 5400 levels.
Option writing clues
Option writing points to support at 8500 and resistance at 8700. This is as per yesterday's data.
Let's see how markets behave at these levels.

Let's see how markets behave at these levels.
Subscribe to:
Posts (Atom)