March 31, 2019


Wild fluctuation in S&P 500 PE in 2008-2009 explained
In 2008-2009, the S&P 500 PE ratio went from 20 to 120 and then back to 20... all this in 1 year.
What was the reason?
What was the reason?
Vishvesh Chauhan: A systems trader par excellence @iamVishChauhan
All throughout, my focus was on price and volume. I was taught that irrespective of whether you are a promoter, analyst, trader, fund manager or insider you can do only two things when you come to the market: buy or sell stocks. Now, if you trade in large volumes, you will leave your signature on the market.
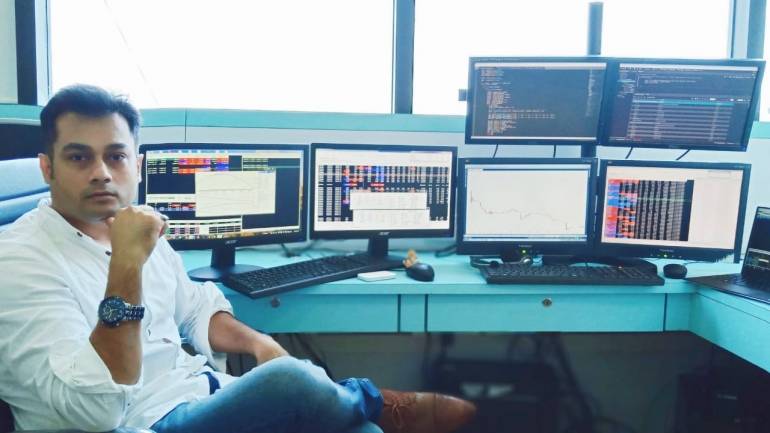
Reading price and volume data gives an insight into what the ‘smart money’ is doing. I have always looked to read the price and volume data to understand the force behind the price action.
Having said that, one needs to know that the market is nothing but a mass psychology reflector. There are three emotions – fear, greed and hope – prevalent in the market at all times. One can only take unbiased decisions in the market if he is detached from these emotions.
Now, markets have an inherent structure. The puzzle is to crack the structure. If you can do it, you can forecast overall behaviour to a large extent, though you may never always be right.
Trading techniques can be developed using these structures. However, there is a flaw in such technique. The flaw is the bias that comes with this strategy. In order to remove these biases, I decided to codify the system. But coding the system is a huge task, if one wishes to incorporate all parameters.
Read more at https://www.moneycontrol.com/news/business/markets/vishvesh-chauhan-a-systems-trader-par-excellence-3728741.html
March 30, 2019


March 29, 2019
Market outlook
Daily charts:
- trend is up on daily charts
- today markets closed 0.5% in positive at 11624
- AD was 5:4
- option writing support 11500 resistance 12000
- trend is up on daily charts
- today markets closed 0.5% in positive at 11624
- AD was 5:4
- option writing support 11500 resistance 12000
Mumbai youth lands Rs.1.2 crore job with Google UK
Happy to have read this in the morning news today.
The college he studied in is 10-15 min away from my house and is not in the top 10 or top 20 colleges of Mumbai. The average salary for graduating engineers in 2nd or 3rd colleges in Mumbai is 4-5 lakhs pa and the offer he got in India was Rs.6 lakhs pa.
But it was his craze for programming which led him to participate in many coding contests and this is how Google came to know of him. He did not contact Google for any job... Google sought him.
He would have got this job even if he was not an engineer!

Read more at https://timesofindia.indiatimes.com/india/mumbai-youth-lands-rs-1-2-crore-job-at-googles-london-office/articleshow/68622969.cms
The college he studied in is 10-15 min away from my house and is not in the top 10 or top 20 colleges of Mumbai. The average salary for graduating engineers in 2nd or 3rd colleges in Mumbai is 4-5 lakhs pa and the offer he got in India was Rs.6 lakhs pa.
But it was his craze for programming which led him to participate in many coding contests and this is how Google came to know of him. He did not contact Google for any job... Google sought him.
He would have got this job even if he was not an engineer!
Read more at https://timesofindia.indiatimes.com/india/mumbai-youth-lands-rs-1-2-crore-job-at-googles-london-office/articleshow/68622969.cms
March 28, 2019

Market outlook
Daily charts:
- trend is up on daily charts
- today markets closed 1.1% in positive at 11570
- AD was 2:1
- option writing support 11000

- trend is up on daily charts
- today markets closed 1.1% in positive at 11570
- AD was 2:1
- option writing support 11000

Learn to take charge
If you want to build a solid trading career, first and foremost, you have to learn to think for yourself.— Trading composure (@yvanbyeajee) March 28, 2019
This is very important.
You can't overly rely on people's analysis, stock picks, and opinions on market direction. Stop feeding that mentality. Take charge.
EquityMaster Uses Trading System With “Nearly 100% Accuracy” To Warn That Nifty May Plunge 5% Soon
...The data does show that after long periods of consolidation, there are spikes in the Nifty.
In November 2016, the Nifty plunged a mammoth 7.54% after three months of sluggishness while in July 2017 and July 2018, it surged a massive 5.43% & 5.46% respectively after three months of consolidation.
Based on this analysis, it is stated that the “chances of a big move more than 5% could be possible during the March or April expiry“.
He has also warned that going by “price action“, the chances of a fall could be higher.
...............
Common sense dictates that every sharp up move in the markets is accompanied by a sharp correction. As the Indices have indeed surged between 10% to 12% from the lows, a sharp move to the downside should not come as a surprise.
Accordingly, it is better if we heed Apurva Sheth’s advice, book profits and take shelter in the bunkers till the correction is over.
There is no point in being adventurous or defiant in these matters!
Read more at http://rakesh-jhunjhunwala.in/equitymaster-uses-trading-system-with-nearly-100-accuracy-to-warn-that-nifty-may-plunge-5-soon/
NOTE: this article was published on 10th MAR and nifty is up 6% this month.
March 27, 2019
Market outlook
Daily charts:
- trend is up on daily charts
- today markets closed 0.3% in negative at 11445
- AD was 4:5
- option writing resistance 11500-11600
- trend is up on daily charts
- today markets closed 0.3% in negative at 11445
- AD was 4:5
- option writing resistance 11500-11600
Bad news makes a good headline...gradual improvements do not
We’ve seen a thousand versions of this chart, but we haven’t seen the opposite, one that plots all of the positive developments over the last nine years. So I decided that would be fun to create, but I quickly realized, as I stared blankly at the screen, that coming up with this list was much harder than I thought it would be.
This reminded me of something Bill Gates said: “Headlines, in a way, are what mislead you, because bad news is a headline, and gradual improvement is not.”

All of the items below were headlines, but they weren’t necessarily “reasons” to buy, which is why I’ll refer to this as the opposite chart, but not really.
See the opposite chart...
Read more at https://theirrelevantinvestor.com/2017/03/20/gradual-improvements-go-unnoticed/
This reminded me of something Bill Gates said: “Headlines, in a way, are what mislead you, because bad news is a headline, and gradual improvement is not.”
All of the items below were headlines, but they weren’t necessarily “reasons” to buy, which is why I’ll refer to this as the opposite chart, but not really.
See the opposite chart...
Read more at https://theirrelevantinvestor.com/2017/03/20/gradual-improvements-go-unnoticed/
March 26, 2019
Market outlook
Daily charts:
- trend is up on daily charts
- today markets closed 1.1% in positive at 11483
- AD was 5:4 (not good)
- option writing support 11000, 11400 resistance 11500
- trend is up on daily charts
- today markets closed 1.1% in positive at 11483
- AD was 5:4 (not good)
- option writing support 11000, 11400 resistance 11500
March 25, 2019
NIFTY options open interest distribution
- highest OI at 11500 CE and then 11600 CE
- in puts, highest OI at 11000 PE and cluster at 11300 PE to 11200 PE
- March expiry

Source: http://opstra.definedge.com/openinterest
- in puts, highest OI at 11000 PE and cluster at 11300 PE to 11200 PE
- March expiry

Source: http://opstra.definedge.com/openinterest
Market outlook
Daily charts:
- trend is up on daily charts
- today markets opened gap down and closed 0.9% in negative at 11354
- AD was 1:3
- swing low 10600 swing high 11600
- trend is up on daily charts
- today markets opened gap down and closed 0.9% in negative at 11354
- AD was 1:3
- swing low 10600 swing high 11600
Expiry between 11300 and 11600? @Amit_Gulecha
Nifty— KAUNfused CRAFTSman (@Amit_Gulecha) March 22, 2019
- 11600 highest CE oi
- 11450 straddle at 140 so expiry range is 11300-11600 as of now
- 11300-400-500 all 3 puts have approx 24-25 lk OI pic.twitter.com/qJgVZMsVFc


March 23, 2019

NIFTY weekly charts
- trend is up
- this week, nifty traded in a small range and closed flat
- support 11000

- this week, nifty traded in a small range and closed flat
- support 11000

BANKNIFTY daily and weekly charts
- trend is up
- now trading at all time highs
- from 27000 to 30000, index maintained higher high higher lows
- Friday we saw this break and index formed a bearish engulfing bar
- there is no swing low between 26500 and 30000
- a correction may lead to formation of a higher swing low
- now trading at all time highs
- from 27000 to 30000, index maintained higher high higher lows
- Friday we saw this break and index formed a bearish engulfing bar
- there is no swing low between 26500 and 30000
- a correction may lead to formation of a higher swing low
March 22, 2019
Market outlook
Daily charts:
- trend is up on daily charts
- today markets closed 0.6% in negative at 11457
- AD was 1:2
- bearish engulfing bar formed; however size of prev bars is too small
- note there is no swing low between 10600 and 11600
- option writing support 11000 resistance 11600
- trend is up on daily charts
- today markets closed 0.6% in negative at 11457
- AD was 1:2
- bearish engulfing bar formed; however size of prev bars is too small
- note there is no swing low between 10600 and 11600
- option writing support 11000 resistance 11600
The BJP (website) is back online
After weeks of « maintenance » the @BJP4India website is back... Well, it’s not really the website, it’s just 1 static page.— Elliot Alderson (@fs0c131y) March 22, 2019
That confirms what I said: following the hack, they lost everything and they did not have any backups...🤦♂️ pic.twitter.com/b1MrjQwdRY
Orange Skin, Thick Bones, and All the Other Ways the Human Body Could Change on Mars
...we should expect a fair bit of evolutionary divergence between Mars settlers and the human population on Earth, according to Rice University biologist Scott Solomon, who examined this possibility in his 2016 book Future Humans: Inside the Science of Our Continuing Evolution. That divergence will start unspooling at the outset, thanks to something called “the founder effect.” No matter how or when it happens, the Red Planet will be settled by a relatively small group of people who are not perfectly representative of the entire human population. For example, it’s a pretty safe bet that Mars pioneers will be atypically adventurous and risk-tolerant. That means, Muskton — the odds are decent that the first Red Planet burg will be named after SpaceX’s CEO — will likely feature more rock-climbing gyms and bordellos per capita than cities here on Earth.
And those initial differences will snowball, because Mars and Earth are very different worlds. The Red Planet is much smaller; the force of gravity on its surface is just 38 percent of the pull we feel here on Earth. Mars also lacks ...
Read more at https://medium.com/s/thenewnew/orange-skin-thick-bones-and-all-the-other-ways-the-human-body-could-change-on-mars-805245d4463

How much of this is fake news?
The media controls what it wants to show you and decides how to present it. ... it all depends on the hidden agenda which you will never know.

March 20, 2019
Market outlook
Daily charts:
- trend is up on daily charts
- today nifty closed flat at 11521
- AD was negative at 7:11
- option writing support 11000
- trend is up on daily charts
- today nifty closed flat at 11521
- AD was negative at 7:11
- option writing support 11000
Ericsson teaches Anil Ambani and India's nascent bankruptcy system a lesson
... Ericsson’s lawyers will deserve a glowing mention. For an unsecured creditor to walk away with a 48 percent recovery of its claim – while secured lenders wait patiently for RCom to sell its spectrum, redevelop its land assets and pay them something – shows that the Swedish firm played its cards well.
It also shows the secured creditors, led by State Bank of India, in a rather poor light. They have been deluding themselves since June 2017, when they agreed to an out-of-court restructuring, including a plan to convert part of their debt into equity at almost 25 rupees a share.
Read more at https://www.business-standard.com/article/companies/ericsson-teaches-anil-ambani-and-india-s-nascent-bankruptcy-system-a-lesson-119031900331_1.html
March 19, 2019


Market outlook
Daily charts:
- trend is up on daily charts
- today markets closed 0.6% in positive at 10532
- AD was flat
- pattern formed today was "hanging man"
- this is after a shooting star and doji formed in past 2 days
- higher highs and higher lows is still being maintained
- but patterns show signs of selling everyday (AD not supporting)
- option writing support 11000 - this has not increased. Why?
SIP and dip: Is the dream run over for systematic investment plans?
Janya Menghrajani Desai, 30, was interning with a financial planner in July 2017 when she learnt about Systematic Investment Plans (SIPs) and, considering her risk-averse nature, decided it would be a good way to put money aside as well as ensure it grows. “I’m not someone who takes the risk of investing in stocks directly, so when the planner told me about SIPs, I said why not,” says Desai.
In the past 20 months she has put in ₹1 lakh but made exactly ₹520 on it. “It’s not even 1 percent,” she says, adding that if she had even left it in her savings account, she would at least have made 4 percent. She plans to wait and watch for a few months after the elections in May and then, if the situation doesn’t improve, pull the money out.
Read more at http://www.forbesindia.com/article/investment-special-2019/sip-and-dip-is-the-dream-run-over-for-systematic-investment-plans/52823/1
Find a trading approach that suits you best
Here's the deal:— Rayner Teo (@Rayner_Teo) March 19, 2019
There's no best timeframe out there. Likewise, there is no best indicator, strategy, or whatsoever.
It depends on you — your goals and what you want from trading.
Once you figured it out, then you can find an approach that suits you best.
March 18, 2019
Market outlook
Daily charts:
- trend is up on daily charts
- today markets closed 0.3% in positive at 11462
- AD was negative 7:10
- past 2-3 days, breadth is negative
- Friday, we had a shooting star
- today a doji/ spinning top was formed (indecision between bulls and bears)
- option writing support 11000
- trend is up on daily charts
- today markets closed 0.3% in positive at 11462
- AD was negative 7:10
- past 2-3 days, breadth is negative
- Friday, we had a shooting star
- today a doji/ spinning top was formed (indecision between bulls and bears)
- option writing support 11000
Was the recent 737 Max crash a software problem?
Interesting thread on design issues and band aid fixes
Some people are calling the 737MAX tragedies a #software failure. Here's my response: It's not a software problem. It was an— Trevor Sumner (@trevorsumner) March 16, 2019
* Economic problem that the 737 engines used too much fuel, so they decided to install more efficient engines with bigger fans and make the 737MAX.
There are no perfect entries
There are no perfect entries:— Rayner Teo (@Rayner_Teo) March 18, 2019
Breakout may be false
Pullback may never come
"Confirmation" may be late
The faster you accept, the faster you learn

March 17, 2019
Inverse correlation between USDINR and Nifty
- When the USDINR tops out, our markets bottom out.
- don't focus on exact date...
USDINR chart
- don't focus on exact date...
USDINR chart
Simpler GST turns out to be bad business for India's tax consultants
MUMBAI: For a newly minted partner in one of the Big Four professional services firms, becoming a stay-at-home dad had never crossed his mind. That, until last month.
He had joined the company as a partner in 2016, with a 30% pay hike, from a rival firm. With an eight-figure salary, a chauffeur-driven, high-end German car and a penthouse in a tony Bengaluru neighbourhood, it looked like a perfect job. He is now on gardening leave - a six-month cooling-off period that a partner must ob ..
Read more at: http://economictimes.indiatimes.com/articleshow/68434874.cms
March 16, 2019

NIFTY weekly charts
- trend is up on weekly charts
- this week, there was a very good breakout above 11000 levels
- option writers feel that 11000 will not break this series
- rejecting H&S view.... it was educational while it lasted
- confirmation was break of 10000... this never happened and we had a breakout on upside
- retest of 11000 this week can negate bullish view (longer time it takes the better)

March 15, 2019

Market outlook
Daily charts:
- trend is up on daily charts
- today nifty closed 0.7% in positive at 11426
- close was near halfway of the bar
- pattern formed... shooting star
- AD was negative at 7:10
- past 2-3 days, AD is not great
- trend is up on daily charts
- today nifty closed 0.7% in positive at 11426
- close was near halfway of the bar
- pattern formed... shooting star
- AD was negative at 7:10
- past 2-3 days, AD is not great
Market outlook
Daily charts:
- trend is up on daily charts
- today markets closed flat at 11343
- sequence of higher highs higher lows is maintained
- however size of the bars is getting smaller
- AD was 4:5
- support 11000-10600
- option writing support 11000 resistance 11500
- trend is up on daily charts
- today markets closed flat at 11343
- sequence of higher highs higher lows is maintained
- however size of the bars is getting smaller
- AD was 4:5
- support 11000-10600
- option writing support 11000 resistance 11500
March 14, 2019
Freak trade in NIFTY Futures on 13-MAR?
- see first bar on 13th March
- nifty made a low of 11100
- till 3.15pm, this was not visible on my datafeed
- this is inspite of 2 disconnections forcing me to backfill twice
- logged off markets at 3.15pm and logged in at 5.30
- automatic backfill showed this huge big bar which was missing all day long
- I thought this was a freak trade hence deleted first minute of the day
- today when I start datafeed, the huge bar comes again.
- this bar did not appear on upstox intraday charts yesterday
- even today, upstox shows yesterday first bar low around 11300 and not 11100
- whom to trust???


March 13, 2019

Market outlook
Daily charts:
- trend is up on daily charts
- today nifty closed 0.4% in positive at 11342
- AD was 6:11
- hanging man formed today; small body
- check last week of AUG charts and this month charts
- small correction possible?
- I am now getting bullish on long term... see separate post on this
- option writing support 11000
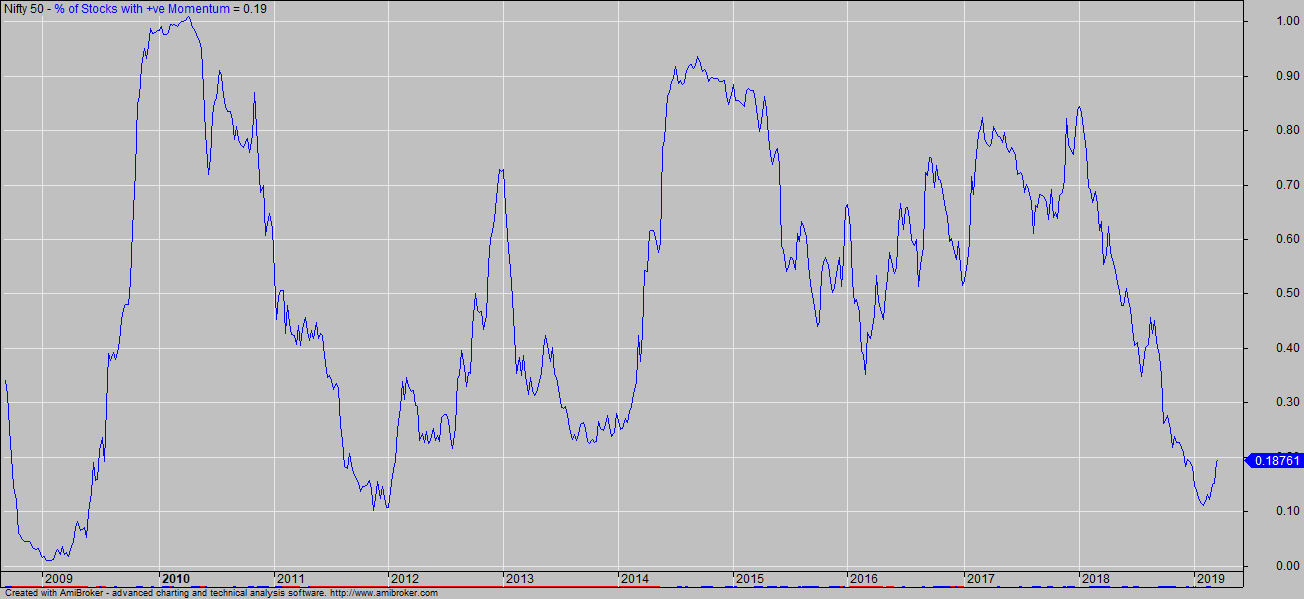
Are we at the start of a new bull run?
These charts/ breakouts are the reason I have become bullish...
See the gains after the breakout
I am expecting a repeat of this... so excellent opportunities in next 2-3 years.
See the gains after the breakout
I am expecting a repeat of this... so excellent opportunities in next 2-3 years.
March 12, 2019
Stock signals 12-MAR-2019
Nifty 200 stocks... recommended list for trading
- Liquidity filter: ||||| good liquidity - ||||| excellent liquidity. Avoid stocks with ||||| low liquidity.
| Stock name | Close | Change | 20 Day Swing Indicator | Last Month's | 52 week | |||||
|---|---|---|---|---|---|---|---|---|---|---|
| Trend | Date | Stoploss | Reversal | High | Low | High | Low | |||
| ||||| ADANIPORTS | 361.05 | 2.50% | BUY | 12/03/19 | 315.75 | 315.75 | 359 | 316 | 416 | 292 |
| ||||| AJANTPHARM | 1043.05 | 5.50% | BUY | 12/03/19 | 945.50 | 945.50 | 1031 | 903 | 1458 | 896 |
| ||||| ALKEM | 1736.25 | -0.50% | SELL | 08/10/18 | 1800.00 | 1897.90 | 1929 | 1737 | 2268 | 1726 |
| ||||| APOLLOTYRE | 226.80 | 4.00% | BUY | 28/02/19 | 206.45 | 196.70 | 218 | 194 | 307 | 192 |
| ||||| ARVIND | 93.35 | 6.50% | BUY | 07/03/19 | 72.80 | 72.80 | 89 | 73 | 120 | 73 |
| ||||| AUROPHARMA | 773.25 | 3.00% | BUY | 12/03/19 | 695.00 | 695.00 | 805 | 695 | 830 | 527 |
| ||||| BALKRISIND | 935.45 | 3.00% | BUY | 25/02/19 | 856.50 | 802.70 | 905 | 744 | 1454 | 744 |
| ||||| BATAINDIA | 1368.25 | 2.00% | BUY | 01/11/18 | 1271.25 | 1182.30 | 1330 | 1116 | 1374 | 674 |
| ||||| BHARATFIN | 988.65 | 3.50% | BUY | 12/03/19 | 914.30 | 912.20 | 970 | 912 | 1235 | 824 |
| ||||| CASTROLIND | 167.10 | 1.00% | BUY | 12/03/19 | 148.50 | 145.75 | 162 | 145 | 214 | 135 |
| ||||| DBL | 621.85 | 3.50% | BUY | 15/02/19 | 412.50 | 358.00 | 478 | 312 | 1248 | 312 |
| ||||| DLF | 187.75 | 6.00% | BUY | 05/03/19 | 161.85 | 154.40 | 181 | 152 | 227 | 142 |
| ||||| DMART | 1510.60 | 1.50% | BUY | 12/03/19 | 1440.00 | 1403.15 | 1526 | 1376 | 1699 | 1126 |
| ||||| EDELWEISS | 179.70 | 3.50% | BUY | 05/03/19 | 135.35 | 115.60 | 156 | 116 | 342 | 116 |
| ||||| EXIDEIND | 230.35 | 1.50% | BUY | 12/03/19 | 210.70 | 194.30 | 231 | 194 | 305 | 194 |
| ||||| GLENMARK | 635.25 | 3.00% | BUY | 12/03/19 | 571.75 | 554.00 | 665 | 554 | 712 | 494 |
| ||||| GSPL | 180.55 | 4.00% | BUY | 12/03/19 | 153.70 | 148.65 | 180 | 149 | 207 | 149 |
| ||||| HAVELLS | 765.45 | 3.00% | BUY | 30/10/18 | 689.35 | 665.45 | 754 | 665 | 770 | 484 |
| ||||| HDFCBANK | 2171.00 | 2.00% | BUY | 12/03/19 | 2070.00 | 2070.00 | 2155 | 2073 | 2220 | 1834 |
| ||||| INDHOTEL | 151.05 | 4.50% | BUY | 12/03/19 | 136.30 | 134.10 | 147 | 134 | 156 | 109 |
| ||||| INDUSINDBK | 1569.05 | 3.50% | BUY | 12/03/19 | 1458.20 | 1455.00 | 1557 | 1455 | 2038 | 1333 |
| ||||| INFY | 706.95 | -0.50% | SELL | 08/03/19 | 752.60 | 760.35 | 772 | 721 | 772 | 551 |
| ||||| LT | 1388.90 | 3.00% | BUY | 07/03/19 | 1253.00 | 1201.10 | 1335 | 1201 | 1460 | 1182 |
| ||||| M&M | 687.90 | 1.00% | BUY | 12/03/19 | 640.00 | 615.60 | 715 | 616 | 993 | 616 |
| ||||| MRPL | 73.10 | 1.00% | BUY | 05/03/19 | 62.25 | 62.00 | 69 | 62 | 117 | 61 |
| ||||| NMDC | 111.90 | 0.50% | BUY | 28/02/19 | 96.20 | 91.10 | 102 | 91 | 126 | 89 |
| ||||| SRTRANSFIN | 1272.45 | 1.00% | BUY | 26/02/19 | 1080.30 | 994.80 | 1154 | 995 | 1669 | 902 |
| ||||| SUNPHARMA | 470.30 | 2.00% | BUY | 05/03/19 | 422.85 | 412.35 | 455 | 403 | 679 | 370 |
| ||||| TATAGLOBAL | 204.90 | 1.00% | BUY | 12/03/19 | 185.35 | 178.60 | 208 | 177 | 300 | 177 |
| ||||| TITAN | 1086.45 | 1.50% | BUY | 10/01/19 | 1002.05 | 1002.05 | 1077 | 985 | 1096 | 732 |
| ||||| TORNTPHARM | 1841.90 | 2.50% | BUY | 01/11/18 | 1758.50 | 1743.10 | 1860 | 1743 | 1962 | 1221 |
| ||||| VGUARD | 221.75 | 1.00% | BUY | 01/03/19 | 187.65 | 183.40 | 211 | 183 | 255 | 159 |
Get this report everyday by email. Click here for more info.
Market outlook
Market outlook:
- trend is up on daily charts
- today nifty closed 1.2% in positive at 11301
- AD was 11:7
- swing low support 10600 resistance 11400/ 11500 (minor)
- strong support expected around 11000
- trend is up on daily charts
- today nifty closed 1.2% in positive at 11301
- AD was 11:7
- swing low support 10600 resistance 11400/ 11500 (minor)
- strong support expected around 11000


March 11, 2019
Market outlook
Daily charts:
- trend is up on daily charts
- today nifty closed 1.2% in positive at 11168
- AD was 13:5
- breakout from 3-4 month range has been on upside
- is H&S pattern over?
- note that it was being formed and confirmation was break of 10000
- so far this has not happened
- bearish tristar was seen last week
- no confirmation this week so we ignore this
- swing low support 10600
- option writers bullish that 11000 will not break this series
Irony: it is election time and BJP will be back soon
- the official site was hacked few days ago
- since then the site is down and looks like they have no backup
- it is now election season and we don't know if BJP will be back or not
- but the message is clear on the site - We'll be back soon

- since then the site is down and looks like they have no backup
- it is now election season and we don't know if BJP will be back or not
- but the message is clear on the site - We'll be back soon
Vivek Gadodia: From system analyst to market wizard

I have been a good student throughout my school and college life, who topped the class and studied to get the perfect score. This 35-40 percent win rate in the market did not match with my expectations of being right all the time.
I was constantly in search of the proverbial Holy Grail. The eureka moment for me was the Ed Seykota interview in Market Wizard. His 'Whipsaw Song' exemplifies the predicament of a trend follower. He says 'One good trade makes for all the small losses' which clicked with me.
Read more at https://www.moneycontrol.com/news/business/markets/vivek-gadodia-from-system-analyst-to-market-wizard-3627021.html
March 10, 2019

March 9, 2019
NIFTY weekly charts
- trend is down on weekly charts
- H&S pattern seen on chart
- Right shoulder under development
- confirmation of pattern will be break of 10000

- H&S pattern seen on chart
- Right shoulder under development
- confirmation of pattern will be break of 10000

CNX 500 chart
- index is trading sideways
- now at resistance 9260
- double top/ bearish tri star formed
- confirmation will be break of 9200 tomorrow

- now at resistance 9260
- double top/ bearish tri star formed
- confirmation will be break of 9200 tomorrow
March 8, 2019
Market outlook
Daily charts:
- trend is up on daily charts
- today nifty closed 0.2% in negative at 11035
- this is the first weekly close above 11000 after 23 weeks
- AD was flat
- bearish tri star pattern formed on daily charts
- confirmation will be gap down opening below 11000 on Monday
- but option writers are bullish 11000 will not break
- so interesting week ahead
Will NIFTY give a bearish 3 star pattern today?
 The bearish Tri Star candlestick pattern is a bearish reversal pattern composed of three candles signaling the reversal of an uptrend.
Each of the Tri Star’s candles are Doji’s. Because it is extremely rare to see this candlestick pattern on your charts, when you do happen to come across it, it should not be ignored.
A few criteria must be met in order for the Tri Star pattern to be considered a valid bearish reversal signal:
Read more at http://www.candlestickpatterns.org/3-candle-patterns/tri-star-bearish/
S&P 500 60 min charts
- double top sell
- since then the index is breaking supports
- if 2740 breaks, expect correction to 2685
- I don't expect 2685 to break
- on higher degree timeframe charts, an inverted H&S may be forming

- since then the index is breaking supports
- if 2740 breaks, expect correction to 2685
- I don't expect 2685 to break
- on higher degree timeframe charts, an inverted H&S may be forming
March 7, 2019
Morgan Stanley sees Sensex at 42,000 by Dec
No provision for a bearish case?

Read more at http://economictimes.indiatimes.com/articleshow/68303457.cms
Read more at http://economictimes.indiatimes.com/articleshow/68303457.cms
Market outlook
Market outlook:
- trend is up on daily charts
- today markets closed flat at 11058
- AD was flat
- option writers expect 11000 to hold this series
- swing low 10600 resistance 11200 region
- trend is up on daily charts
- today markets closed flat at 11058
- AD was flat
- option writers expect 11000 to hold this series
- swing low 10600 resistance 11200 region


March 6, 2019
Market outlook
Daily charts:
- trend is up on daily charts
- today markets closed 0.6% in positive at 11053
- this is the second close above 11000 this year (1st attempt was 6th Feb)
- AD was 2:1
- option writers bullish 11000 will not break this series
- swing low 10600 resistance 11150-11200 (will break)
- trend is up on daily charts
- today markets closed 0.6% in positive at 11053
- this is the second close above 11000 this year (1st attempt was 6th Feb)
- AD was 2:1
- option writers bullish 11000 will not break this series
- swing low 10600 resistance 11150-11200 (will break)
Option writing clues
- writers are bullish and do not expect 11000 to break this series
- till yesterday, highest OI was at 10800 PE... now it has jumped to 11000 PE
- added one more pair in puts (short 11000 PE and long 10900 PE)

- till yesterday, highest OI was at 10800 PE... now it has jumped to 11000 PE
- added one more pair in puts (short 11000 PE and long 10900 PE)

March 5, 2019
Subscribe to:
Posts (Atom)