August 31, 2019

NIFTY monthly chart

- trend is up
- support around 10000

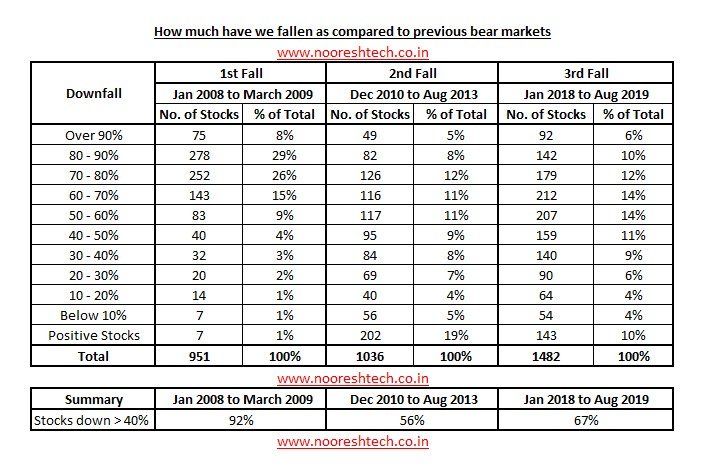
- markets have been flat from Jan 2018


NIFTY weekly charts

- trend is down
- this week a doji was formed
- past 3-4 weeks we are seeing signs of buying coming in
- sustaining above 11200 will be bullish


BANK NIFTY technicals

- trend is down
- good support around 26500
- swing high 28500


Just love the way every single media house is magnifying this bad news.

Get ready to say good bye to $5 trillion economy

August 30, 2019

On judging someone by what they don't have

Market outlook

Daily charts:
- trend is down and will reverse on close above 11200
- today nifty closed 0.7% in positive
- AD was 10:7

- today was a volatile day
- intraday swing (up and down) was 300 points
- AD was however flat even when nifty was down
- one could see buying in midcap/ small cap stocks
- so bias was slowly turning bullish near day's low

- today upstox charts were not working in first half of the day

- a crude H&S is forming and will be complete once NF closes above 11200

- this month net move in nifty is 40 points
- but swings were 200 points +/- from 11000 level

Message from Smart Money to Retail Investors

When the politically impossible becomes the politically inevitable

The economy has slowed. Now that there is a consensus on that, the debate has moved to how severe it is, how long it can last, and where the intervention needs to be. Like a snowball that grows bigger as it rolls on, economic momentum builds in a certain direction till a force (intervention) is applied. The later the response, the stronger the necessary intervention.


This amplification of the prevailing trend plays out on several fronts. Let us start with financial conditions. Once financing conditions tightened after the default by a large financial firm about a year back, the resultant economic weakness pushed more firms into default.

For a few quarters, private financial firms that had the potential to grow took advantage of the lack of competition and grew their loan-books profitably. But now, as the underlying issues stayed unresolved and growth has weakened further, afraid of new bad loans, even they are slowing down credit disbursement. This is now likely to cause the next round of weakness.

Read more at https://indianexpress.com/article/opinion/columns/seize-the-economy-slowdown-5949149/

Some buy signals

- based on kplswing indicator
- this is not the first signal for many stocks

Stocks trading above 6 months high

Stocks at all time high


NHAI’s Giant Liabilities: Is There a Solution That Doesn't Tax Us More?

NHAI’s gigantic debt, contingent liabilities, stalled projects and web of litigation across the country, are turning into the biggest roadblock to infrastructure development. Union minister Nitin Gadkari has ignored this for five years, even as he criss-crossed the country announcing mega projects with massive outlays. Reports that the prime minister’s office (PMO) has rapped the ministry for extensive and ‘reckless’ highway expansion, finally, led to a much-needed public discussion last week.

NHAI has reportedly been asked to discontinue construction of roads and monetise assets; this has happened only after NHAI’s debt soared from Rs40,000 crore in 2014 to an unsustainable Rs1.78 lakh crore in 2019 under Mr Gadkari’s watch.

Read more at https://www.moneylife.in/article/nhais-giant-liabilities-is-there-a-solution-that-doesnt-tax-us-more/58045.html

August 29, 2019

The government has no business to be in business

We forget old predictions and want new ones

Ask your guru to trade in front of you

Market outlook

Daily charts:
- trend is down on daily charts
- today markets closed 0.9% in negative at 10948
- AD was 7:12

- my hopes of H&S are playing out so far
- for completion, nifty should form a higher swing low and
- then break out above 11200
- till then, this is just talk

Weird datafeed problems

- about a minute of market open, nifty futures showed a low 10805
- this did not happen on the first tick but much later
- data integrity is seriously in doubt
- see the charts... sends everything for a toss
- but broker charts were clean
- no point in complaining to NSE
- per NSE any move within circuit range is fine.

- this issue was active on twitter also
- OI figures were not being updated on NSE site


This is ridiculous

One of the finest novels and a classic ever written "War and Peace" by Leo Tolstoy...  cannot be kept at home. 

You might be considered antinational...


Read more here

August 28, 2019

Swiss bank nahi toh RBI sahi

Market outlook

Daily charts:
- trend is down on daily charts
- today markets closed 0.5% in negative at 11046
- AD was 7:11

- markets could not cross prev day's high
- markets broke prev day's low but recovered sharply
- support is emerging around 10990-11000 range

HDFC AMC... what can go wrong?

- a safe stock now trading at all time high
- income is mgmt fees of mutual fund
- no performance guarantee
- AUM increase means increase in income
- so what can go wrong

August 27, 2019

My trading today was like........


Market outlook

Daily charts:
- trend is down on daily charts
- today nifty closed 0.4% in positive at 11105
- AD was 13:5 (or slightly better than 2:1)

- stiff resistance around 11200

- how about an H&S forming with neckline at 11200?
- right hand shoulder (RHS) is yet to be formed
- but no harm in just guessing
- RHS formation would mean another decline leading to higher swing low

Well said

Image

Where can you get trapped?

Open positions and stoploss


StockClose% ChangeBought atBuy DateRemarksTrailing StoplossReturns %
ASIANPAINT1597.551.09156606/08/2019Hold long positions15502.02
AUROPHARMA590.00-1.3859808/08/2019Hold long positions560-1.34
BAJAJ-AUTO2736.80-0.45260102/08/2019Hold long positions26505.24
COLPAL1201.350.84121008/08/2019Hold long positions1180-0.70
DMART1531.054.14145109/08/2019Hold long positions14505.53
HCLTECH1092.850.54108808/08/2019Hold long positions10400.42
HEROMOTOCO2590.95-1.87246906/08/2019Hold long positions25504.96
KOTAKBANK1512.802.90148506/08/2019Hold long positions14451.85
PIDILITIND1386.351.96130906/08/2019Hold long positions13255.93
SBILIFE827.100.7178706/08/2019Hold long positions7705.07
TATAGLOBAL269.051.1727106/08/2019Hold long positions255-0.55
TCS2276.301.27225808/08/2019Hold long positions21400.81

NIFTY alert by @Zafargs79

Hot stocks and charts

LAST updated: 26-AUG-2019 
INDIGO
INDIGO chart

August 26, 2019

BANKNIFTY chart

- swing high around 28500
- breakout above this can lead to a new rally

Market outlook

Daily charts:
- trend is down on daily charts
- I will call trend as up once it closes above 11200 (swing high)
- this is for sake of consistency

- Friday was a bullish piercing pattern
- this called up for a big gap up which happened today
- the following sell off caused a 300 points wild swing
- the close near day's high
- very good chances of 11200 being taken out

- I am already hearing talks of 12000 being taken out!

- only problem is nifty OI shows short covering and not long buildup.

- the swing gave an excellent opportunity for bulls and bears to profit
- sadly, it also would have caused huge losses to the disciplined trader
- I know people who were long on the first bar and some others who shorted after 100/ 150 points fall

- today's pattern is "hanging man" ... this is bearish
- this pattern is important only after a strong rally last 8-10 or 10-15 days
- this is not the case this time so we can safely assume rally will continue

- today's close was at 11057 (2% positive)
- AD was 2:1

Compounding happens too slowly...

August 25, 2019

Suddenly a very bullish view? what about PE ratio?

Salary is nothing but a subscription amount

NIFTY weekly charts

- trend is down
- weekly close below 11000
- Friday's bar had very strong buying
- resistance 11200

- deep support 10000

August 24, 2019

2 new words....

Sensex resistance on hourly charts


BANKNIFTY resistance on hourly charts


NIFTY resistance on hourly charts


US markets S&P 500

- yesterday US markets closed 2.6% in negative
- but the index is trading in a range
- now the fall has brought the index to lower end of range
- this level should now offer support


August 23, 2019

Short covering - futures OI analysis

ADANIPOWER - AMARAJABAT - ARVIND - ASHOKLEY - BANKINDIA - BEL - BIOCON - BPCL - CANBK - CENTURYTEX - CHOLAFIN - COALINDIA - ENGINERSIN - ESCORTS - GAIL - GLENMARK - GMRINFRA - GRASIM - HDFC - HINDALCO - IDEA - IDFCFIRSTB - INDIGO - IOC - JINDALSTEL - JSWSTEEL - LICHSGFIN - MANAPPURAM - MCDOWELL_N - MCX - MFSL - MGL - MUTHOOTFIN - NBCC - NCC - OIL - PAGEIND - PEL - PNB - PVR - RAMCOCEM - RBLBANK - RELIANCE - RELINFRA - SAIL - SUNPHARMA - TATAELXSI - TATAGLOBAL - TATAMOTORS - TATAPOWER - TATASTEEL - TITAN - UBL - UNIONBANK - UPL - VEDL - ZEEL

Finally the FM blinks

Aug 23, 05:38 PM (IST)
It has been decided that enchanced surcharge levied on long term and short term capital gains on equities goes, said FM Sitharman.

Aug 23, 5:45 PM (IST)
Banks have agreed to pass on all Repo Rate cuts into their MCLR, said FM Sitharaman.

Aug 23, 5:44 PM (IST)
An additional capital of Rs 70,000 crore has been sanctioned for banks, which will enable loans worth Rs 5 lakh crore, said FM Sitharaman.

Aug 23, 05:42 PM (IST)
Section 56 2(b) Of I-T Act not to be applicable for startups registered with DPTIT, said FM Sitharaman.

Aug 23, 05:41 PM (IST)
The surcharge on FPIs and domestic investors goes, says Finance Minister

Aug 23, 05:37 PM (IST)
All assessments will be cleared in three months, said FM Sitharaman.

Aug 23, 05:36 PM (IST)
Issue of I-T orders, summons and letters etc shall now go through a centralised system from October 1, said FM Sitharaman.

Read more at https://www.moneycontrol.com/news/business/fm-nirmala-sitharaman-press-conference-live-updates-finance-minister-expected-to-address-fpi-surcharge-issue-4366441.html

Market outlook

Image result for piercing candlestickDaily charts:
- trend is down on daily charts
- today markets closed 0.9% in positive at 10830
- AD was 5:4

- a bullish piercing pattern was formed
- let us see what happens on Monday

- support area 10600
- swing high/ resistance 11200

- today 500+ stocks made new 52 week lows


Amazon's first ad for developers


Unprecedented financial sector crisis in 70 years, says NITI Aayog

Government think tank NITI Aayog on Thursday described the current stress in the financial sector as “unprecedented in the last 70 years”, saying nobody is trusting anyone else in the sector. It made a case for extraordinary steps to deal with the crisis that has resulted in an economic slowdown.

NITI Aayog Vice-Chairman Rajiv Kumar also said there was no business of the government to hold back payments to companies.


“Nobody is trusting anybody else... within the private sector nobody is ready to lend, everyone is sitting on cash... you may have to take steps that are extraordinary,” Kumar said.

Read more at https://www.business-standard.com/article/economy-policy/unprecedented-financial-sector-crisis-in-70-years-says-niti-aayog-119082300053_1.html

3 biggest achievements of BJP

How much have we fallen as compared to previous bear markets? Excellent data by @nooreshtech

Image

August 22, 2019

HINDUNILVR at all time high in this market


Market outlook + multiple timeframe charts

Daily charts:
- trend has turned down today
- there was a strong hint yesterday when nifty closed below 11000 the 2nd time
- last trend change was up on 8-AUG (11032)
- trollers: net loss is 300 points or less than 3% [.03% of capital if you do risk mgmt]

- today nifty closed below 10800... recent swing low
- close was at 10738 down 1.7%
- AD was 1:7

- next support 10600 and then 10000
- resistance/ swing high 11200

- today 490 stocks closed at 52 week low
- small caps index lost 3%... real blood bath here

The cash crunch gets worse

August 21, 2019

NESTLE at all time high...


ITC below 2018 low and also below crucial supports


Market outlook

Daily charts:
- trend is up on daily charts
- today markets closed 0.9% in negative at 10919
- AD was 4:13 ... not good

- today 300+ stocks made new 52 week lows

Serious cash crunch due to an underperforming GST?


..............What is driving this slowdown of the Union government: poor tax collection. The Centre’s share of taxes was 7.3% of the Indian GDP in 2013-’14. By 2018-’19 that number had dipped to 6.9%.

Like in the case of expenditure, there is also the problem of unpredictability. The estimated central government share of taxes as a percentage of GDP at the start of 2018-’19 was 7.9%. But it fell by a whole percentage point when actual taxes were counted up at the end of the financial year. This gap between estimates and actuals was the highest ever in India’s tax history and sent alarm bells ringing in the Union government.

The largest ever gap between estimates and actuals points to a fairly disconcerting state of affairs. How did things come to such a pass?

Read complete article at https://scroll.in/article/934066/in-charts-the-modi-government-is-facing-a-serious-cash-crunch-thanks-to-gst

Social Media Accounts Should be Aadhaar-Linked in 'National Interest': Govt's Top Law Officer Tells SC

My notes:
- government view is you are guilty till proven innocent
- government wants to play nanny to you because you don't know what is good for you
- expect a huge drop in number of trollers
- expect a rise in fake news linked to fraudulently obtained Aadhaar numbers.

- will whatsapp, twitter quit India?


Read more at https://www.news18.com/news/india/govts-top-law-officer-tells-sc-social-media-accounts-should-be-linked-with-aadhaar-in-national-interest-2277055.html

On being a hero

Drop in demand may force Parle to lay off up to 10,000 employees

August 20, 2019

Market outlook

Daily charts:
- trend is up on daily charts
- today nifty closed 0.3% in negative at 11017
- AD was 1:2

- this month, nifty is trading between 10800 and 11200
- but actual net move on closing basis shows no progress
- net move so far is less than 1%

Indian jugaad at its best

August 19, 2019

Beautiful example of survivorship bias

Image

Market outlook

Daily charts:
- trend is up on daily charts
- today nifty closed flat at 11054
- AD was 5:4

- master candle formed on 13-AUG
- high low is 11145 - 10900

August 17, 2019

BANK NIFTY technicals

- trend has turned up
- support 27500
- above 28500, rally possible to 30000


NIFTY weekly charts

- trend is down
- signs of buying coming around 11000 levels
- rally possible to 11500

- nifty PE ratio 27.3


All talk no action in FM and let the economy be damned


August 16, 2019

Market outlook

Daily charts:
- trend is up on daily charts
- today nifty closed marginally in positive at 11048
- AD was flat

- support is slowly shifting up from 10800 to 10900
- above 11200, rally of 200-300 points possible

Next GDP to include "monetary value of cooking at home"?

Make sure you hire the right people for the job

Image

August 14, 2019

Market outlook

Daily charts:
- trend is up on daily charts
- today nifty closed 1% in positive at 11029
- AD was flat

- VIX dropped 8%

RELIANCE charts

- yesterday the stock was up 10% based on some news
- notice that stock failed to sustain above 1300
- this has been a resistance area for some time


And this is the 30 min chart

First time I am seeing a public apology like this


Image

August 13, 2019

Stocks breaking recent supports

LAST updated: 13-AUG-2019 
ARVIND
ARVIND chart

Market outlook

Daily charts:
- trend is up on daily charts
- today nifty closed 1.7% in negative at 10925
- AD was 1:2 (not bad)
- 160 stocks made new 52 week lows (good sign as number usually is 500+)

- there was a hint of correction when markets did not close near day;s high Friday

- today we had a big bar
- this usually means expect correction to continue
- but I said trend is up 2 days ago on 8-AUG (11032)
- now SL is 10800 spot for this notional trade
- in hindsight, correct swing high should have been 11200 and not 11000

- will 10800 break?
- if 10800 breaks, will 10000 be visited?
- what if this is the last leg of the correction? hint...market breadth

- VIX up 14%
- this might mean more pain?

- today RELIANCE was up 10% on good news
- this stock is an index heavyweight and weight is 9%
- if this stock was flat today, index would have been down another 190 points
- try the nifty replica to see how heavyweights influence index

- USDINR is playing havoc with the market - https://www.tradingview.com/x/Yp2HizJh/

You can borrow a system but not the conviction

August 12, 2019

RELIANCE chart

Why is #RELIANCE suddenly trending on twitter?


Meanwhile, another chart and some more views


Interesting data which suggests 5 to 6% upside for Nifty by end of August.

August 11, 2019

Bullish stocks

LAST updated: 09-AUG-2019 
ASIANPAINT
ASIANPAINT chart

NIFTY weekly charts

- first positive weekly close after 5 weeks of decline
- sustaining above weekly high will be bullish
- Friday close was however not encouraging
- a close near weekly high would have been very bullish for coming week


BANKNIFTY charts with kplswing indicator

How to use:
- use higher N for entry (say 20) and
- use lower N for exit (5 or 10)
- these are EOD charts... you can use same logic on lower timeframe charts

N=5


Is mAadhaar worst android app?

One of the world's most well known ethical hacker makes this a topic at Defcon .... UIDAI hates him no end.


DEF CON is one of the world's largest hacker conventions, held annually in Las Vegas. Attendees include computer security professionals, journalists, lawyers, federal government employees, security researchers, students, and hackers with a general interest in software, computer architecture, hardware modification, and anything else that can be "hacked". The event consists of several tracks of speakers about computer- and hacking-related subjects, as well as cyber-security challenges and competitions (known as hacking wargames). Contests held during the event are extremely varied, and can range from creating the longest Wi-Fi connection (aircrack-ng) to finding the most effective way to cool a beer in the Nevada heat.

August 9, 2019

Market outlook

Daily charts:
- trend is up on daily charts
- today nifty closed 0.7% in positive at 11110
- AD was almost 2:1

- inverted hammer formed
- ignoring this right now as trend is too small/ short
- otherwise implication in bearish

- next week, 2 holidays
- Monday and Thursday

August 8, 2019

Market outlook

Daily charts:
- trend is up on daily charts (wef today)
- markets closed above swing high defined yesterday
- today's close was 1.6% in positive at 11032

- new swing low defined at 10800

- AD was 10:7

- see hourly chart for channel

NOTE:
- the fall from 11700 to 10800 has been without any pause
- is a bottom is formed for this year or is a pullback rally happening? I don't know
- a slower upmove from here can mean the bigger correction will resume later on
- another possibility is a rally max to 11500 which then stalls
- trade accordingly with your stops in place

August 7, 2019

Market outlook

Daily charts:
- trend is down on daily charts
- today nifty closed 0.8% negative at 10855
- AD was flat (good sign)

- today only 166 stocks made new 52 week lows
- this is a good sign

- small swing high formed and identified around 11000

- only problem is VIX was up 5% today/ not coming down at all

Hot stocks and charts

ASIANPAINT
ASIANPAINT chart

Share this...