September 29, 2018

Can you be very, very certain -- and wrong?

"Changing the details of an actual memory is a relatively easy thing to do. And it can happen spontaneously."

Washington (AFP) - US Supreme Court nominee Brett Kavanaugh and Christine Blasey Ford, the woman who says he sexually assaulted her decades ago, both say they are convinced their recollections of the past are correct.

But the stories do not match. How can one square the circle?

Elizabeth Loftus, a cognitive psychologist and professor at the University of California, Irvine, says it's possible that both are entirely sincere.

Loftus has spent decades researching human memory, and how those memories can change based on suggestion and other factors -- notably in the legal context. She offered the following thoughts to AFP on the Kavanaugh hearings:

- Sincerity -

Q: Is it possible that both witnesses are sincere?

A: "Absolutely. Certainly she came across as very credible and sympathetic, with most people wanting to believe her, and she seems to definitely believe what she is saying.

"He came across very angry and belligerent, and that is to be expected by someone who is convinced that he is being falsely accused.

"If he did do this, and he has no memory of it because it was so long ago, because maybe he was drinking more than usual and he forgot about that, he could honestly believe his denials."

- False memory -

Q: How commonly can a person misremember details of a real event?

A: "That would be very common. When you have an experience, especially a very upsetting experience... you often remember the core of the event -- you know it was an airplane crash and not a huge fire, and you can remember certain core details, but often many of the peripheral details will suffer.

"And then memory changes over the course of retelling with different audiences -- with the exposure to new information, other details can change.

"We have done studies where we show people an accident -- where a car goes through a yield sign and we suggest later it was a stop sign -- and many people will tell us they remember seeing a stop sign.

"Changing the details of an actual memory is a relatively easy thing to do. And it can happen spontaneously."

Read more at https://www.yahoo.com/news/kavanaugh-hearing-very-very-certain-wrong-202229531.html

BANKNIFTY charts - daily, weekly and monthly

Daily charts:
- trend is down from 4th SEP
- index has shown a near vertical fall
- support developing around 24600

- index will take a long time for a buy signal

NIFTY monthly charts

- trend is up
- support 10000
- this month we had a big red bar
- index down 6%

- one can use kplswing indicator with N=5 as SL

NIFTY weekly technicals with 3 charts

- trend is up
- but markets closed in the red for 4 consecutive weeks
- swing low is at 10000
- this level is too far for SL
- we can consider 10850 as SL

- note that in past 2 years, weekly corrections have lasted for 8-10 weeks and more but have never resulted in a trend reversal

YESBANK: Diamonds are forever

YESBANK is down 46% this month


September 28, 2018

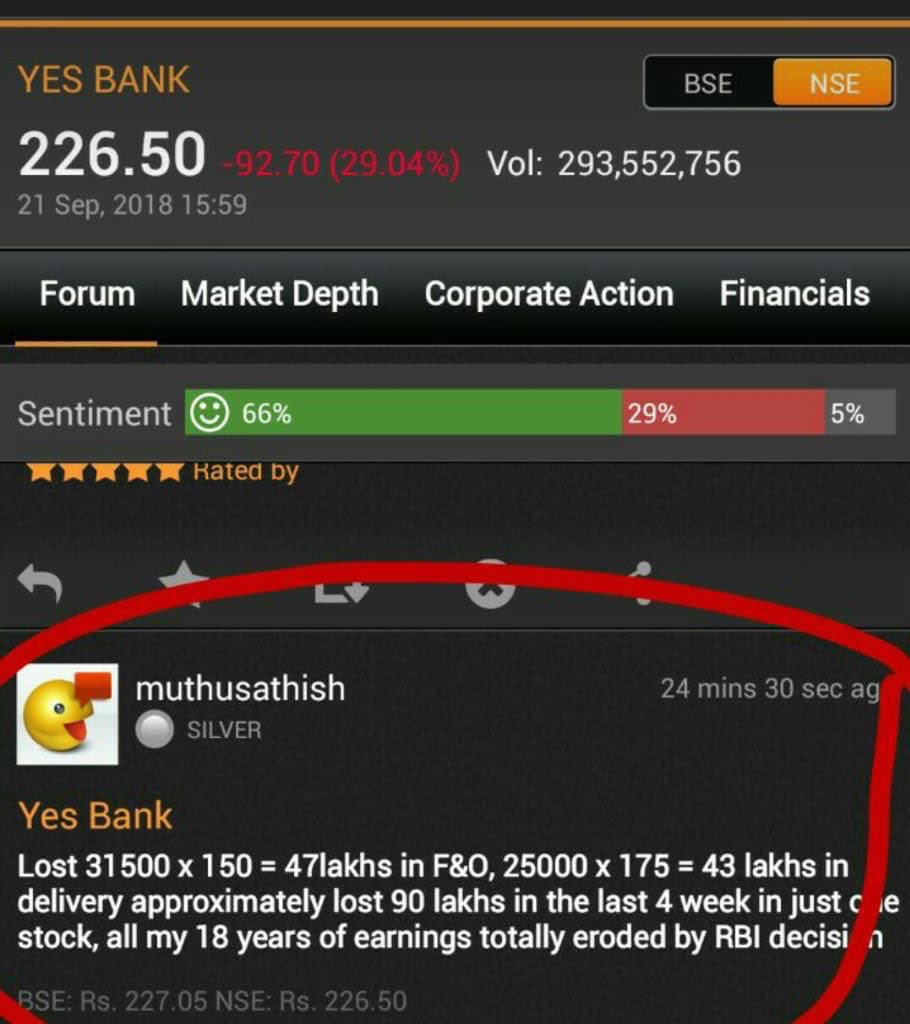
F&O bloodbath

The plight of people holding wrong positions in these F&O stocks....majority

Don't envy the people holding the right position... they are a rarity and will NOT be able to repeat their performance.

INFIBEAM down 70% in one day

NIFTY 200 stocks signals

Stock nameCloseChange20 Day Swing IndicatorLast Month's52 week
TrendDateFixed SLTrailing SLHighLowHighLow
||||| ABCAPITAL114.65-1.50%SELL29/08/18133.45145.00152137214113
||||| AJANTPHARM1063.75-3.00%SELL21/09/181236.001294.00129011261595896
||||| APOLLOTYRE212.25-4.00%SELL13/08/18245.00254.85300249307206
||||| ARVIND317.95-5.50%SELL04/09/18395.95409.40435388478313
||||| BANKINDIA76.90-4.00%SELL21/09/1894.95103.001018821776
||||| BHARTIARTL338.55-5.00%SELL24/09/18391.00397.50399363565331
||||| CENTRALBK41.15-6.50%SELL28/06/1873.5073.5074679440
||||| CENTURYTEX821.55-3.00%SELL21/09/18941.00992.059888881471812
||||| COALINDIA266.25-3.50%SELL28/09/18286.25290.55300262317257
||||| DLF162.55-5.00%SELL25/09/18214.25223.50224184274160
||||| HAVELLS594.50-2.50%SELL10/09/18672.40728.75727625729450
||||| HEROMOTOCO2933.25-5.00%SELL28/06/183200.603345.003350318938832878
||||| IBREALEST87.80-13.00%SELL04/06/18152.80159.0015914026383
||||| JINDALSTEL196.35-12.00%SELL28/09/18246.45246.45228190294136
||||| JSWENERGY61.25-2.50%SELL21/09/1870.7574.5073659860
||||| LT1272.10-2.50%SELL28/09/181367.201390.001374122614701123
||||| M&M860.95-1.50%SELL28/09/18976.70991.60993910993626
||||| MFSL408.30-2.50%SELL31/08/18497.80519.35534447611400
||||| NATIONALUM60.60-6.00%SELL21/09/1871.0078.4578619857
||||| NBCC58.50-5.00%SELL04/09/1870.4074.40807014658
||||| NHPC22.60-1.00%SELL18/09/1825.0527.2026233422
||||| PCJEWELLER62.35-6.50%SELL02/02/1885.3094.651098360159
||||| PIIND711.90-3.00%SELL29/08/18784.95791.008407471034700
||||| SAIL68.25-8.00%SELL11/07/1880.7081.90827410153
||||| STRTECH293.35-7.50%SELL12/09/18348.00368.75375331415220
||||| TATAPOWER65.85-4.00%SELL28/09/1878.9579.00786710266
||||| TV18BRDCST35.10-4.00%SELL30/08/1842.1048.5052457135
||||| UNIONBANK65.75-2.50%SELL05/09/1884.2093.20918419665
||||| VGUARD176.25-1.00%SELL10/09/18203.50229.40229204255172
||||| YESBANK183.65-9.50%SELL31/08/18328.95369.00404336404165

Get this report everyday by email. Click here for more info.

NIFTY spot charts

- 30 min charts
- support at 10850 still holding


Market outlook

Daily charts:
- trend is down on daily charts
- today NF closed 0.4% in negative at 10930
- AD was 1:5
- option writing support 10800 resistance 11500

- note large volatility in past few days
- markets may be forming a short term bottom

- close below 10850 will negate this view

What you believe with all your heart is not necessarily the truth


Irrefutable evidence? And why I don't trust the media


September 27, 2018

Market outlook

Daily charts:
- trend is down on daily charts
- today NF closed 0.7% in negative at 10978
- AD was 5:13

- have markets bottomed out in short term?

OPTIONSORACLE - OPTIONS TRADING ANALYSIS TOOL

OptionsOracle is a free tool for the stock options trading strategy analysis, built for the options traders.

Since options trading is more complex and can involve much higher risk than simple stock trading, traders need to fully understand the options strategy before investing in it. This is where OptionsOracle comes to help. OptionsOracle is a powerful tool that allows testing of different options strategies using real-time options & stock-market information. The tool provides an easy interface to build a stock/options position and then test it using graphs and analytical tools.


Read more at http://www.pasitechnologies.com/2017/03/optionsoracle-options-trading-analysis.html

Download page: http://www.pasitechnologies.com/2015/11/optionsoracle-nse-plugin-v-185.html

I am using the older version (option 1b) as the latest version is not supported on my laptop

More resources: 
learn more about option oracle at youtube
https://www.facebook.com/groups/OptionTradingCourse/.


Madhu Kela on how to identify multibaggers among small and midcaps

To be honest, I have not met a lot of people from SMEs. We have invested in one or two companies from the SME exchange but always at the end of the day, the characteristic remains the same. Is there a clearcut hunger in the entrepreneur? Is he ambitious? Does he understand how to build an organisation? Does he believe people are the centre of success of any organisation? Does he think of financial prudence and capital allocation? And most importantly does he have a vision that any company which  .. 

Read more at: http://economictimes.indiatimes.com/articleshow/65964784.cms

80% of your profits will come from 20% of your trades


September 26, 2018

Market outlook

Daily charts:
- trend is down on daily charts
- today NF closed flat at 11054
- gap up opening with open = high
- AD was flat
- option writing support 11000

- exited 11200 CE bought 2 days ago at breakeven...lucky to get a graceful exit

- did no intraday trades


NIFTY hourly charts with swing indicator

- use N=5 (kplswing indicator) when markets become volatile
- current signal is cover shorts trade long SL 10900
- risk per trade under 1% of trading capital

- one limitation with hourly charts
- first hour is assumed 9.15 to 9.30
- this is software limitation

NIFTY EOD chart with swing indicator

- kplswing with N=5
- more whipsaws but faster exits
- risk per trade under 1% of capital

- current SL for short 11400 spot

September 25, 2018

Trading in volatile markets

After 2-3 years of trading in a low volatility environment, markets have become volatile and this has affected my trading. Suddenly I realise I cannot take a position as risk is too high.

A move which happens in a day then happens in 5 min so what should one do?

The complacency of last 2-3 years has left me unprepared for the current environment and relearning is necessary as what I had learned in the past is sadly forgotten. So much for writing down strategies in a rule book.

Note that I am conditioned for an average trading range of 20 points per hour... now the market can give 40-50 points in 5 minutes!

Here is the chart.... 3 legs each of min 120 points giving a trading range of 360 points. This is huge and is something one gets in a good month!

Top gainers this year after the correction

- When markets recover, these stocks will give good returns
- Do not risk more than 1% of your capital on any trade

Buy signal on 15 min charts

- let us see what happens
- in a downtrend, buy signals usually fail


Market outlook

Daily charts:
- trend is down on daily charts
- today NF closed 0.9% in positive at 11067
- AD was 7:10
- VIX down 5%

- option writing support 11000

- is correction over? base building to start? let's see

Video: Intraday Gap Trading For Quick Stock Market Profits [In Hindi]

Tycoons of tomorrow: Nithin and Nikhil Kamath: Code Zero

...It was then that they decided that Nikhil—who turned out to have a real penchant for trading—would continue to trade, while Nithin would build a brokerage firm. That was how Zerodha came into being, going live in August 2010. The name was a play on zero and the Sanskrit word ‘rodha’, meaning barrier. The brothers wanted to position themselves as facilitators of zero-barrier trading for their clients.

“There was an active futures and options trading community and we started out charging `20 per trade irrespective of the size of the trade,” says Nithin. Those in the business immediately recognised the value of this proposition; otherwise they would be paying a percentage of the value of the trade as fees in the conventional broking system. They would easily save 90-95 percent of that by switching.

The brothers also paid attention to earning trust, because a client still had to transfer money to the broker to put in a trade. “We were the first to come up with a utility that showed all costs upfront, before a single trade was initiated by any client,” Nithin recalls. In 2011, they upgraded technology to allow clients to trade outside the NSE as well.

By 2013, competition had started using the discount broking model, too, and it was clear to the brothers that the future was about becoming a technology company that offered a superior platform for multiple financial services. Zerodha invested in a startup called Tradelab, which built a desktop trading platform that became popular among clients.

Read more at http://www.forbesindia.com/article/tycoons-of-tomorrow/nithin-and-nikhil-kamath-code-zero/51347/1

September 24, 2018

Some Contra Trades ... paper trade with someone else's money

Today... 


Few days ago... short trade worked very well

Market outlook

Daily charts:
- trend is down on daily charts
- today NF closed 1.5% negative at 10975
- AD wsa 1:5

- this was first close in 3 months below 11000
- Friday's low at 10866 not broken as yet

- highest OI at 11000 PE
- not sure how to read this.

Random outcome but consistent results

Image

Norwegian Power Trader Facing Bankruptcy After Massive "Black Swan" Loss

...For readers who haven't been following one of the most stunning cautionary tales about the failure of risk oversight and its consequences, Aas - a legendary power trader with a seat on the Nasdaq Nordic commodities exchange - wracked up a staggering loss that when the spread between German and Norwegian power prices widened by 17 times during a single trading day, an incident that Nasdaq has described as a "a true black swan event."

The blowout was triggered by an extremely unlikely confluence of factors: A jump in the price of European carbon allowances, which caused German power prices to soar, and forecasts for unusually heavy rains in the hydropower-reliant Nordic region, which caused Nordic power prices to drop.

At the time, Aas had a huge open position betting that the spread would narrow. So when it widened by such an extreme degree, Aas was forced to surrender all of his liquid assets to cover his margin. But it wasn't enough, and the exchange was forced to liquidate his position at a massive discount in what is typically an unusually illiquid market (European power markets, once rife with hedge funds and other traders, have seen trading activity plunge over the past two decades as volatility stabilized, eliminating the incentive for speculation).

When the dust had cleared, other exchange members were forced to contribute back-up capital to cover the loss, narrowly averting what could have been a catastrophic collapse.

Read more at https://www.zerohedge.com/news/2018-09-21/norwegian-power-trader-facing-bankruptcy-after-massive-black-swan-loss

Video: Options Buying vs Selling - Which is Better For YOU? by @PRSundar64

Do fundamental factors drive prices?


September 23, 2018

Super bearish on nifty?


Why There is no Future in Options

Why There is no Future in Options ! “Naked” options have got their name for a reason ! Play safe !

Investing is not adventure any day ! Many lives Change their course

@pankajbaid17


Video: Irrational Market Behavior - Analysis | 21 September 2018

September 22, 2018

Notes from a trader

Darvas

Question: in options, which is more profitable intraday or positional?

In your experience is it giving better returns than positional trading. For example, I/m attaching a 2 hour chart of nifty with your own indicator.

Would a positional short according to the sell signal given by the KPL indicator have given more profit than intraday trading?

Indeevar


NIFTY weekly charts

- trend is up on weekly charts (but down on daily charts)
- in 3 weeks, nifty has lost roughly 1000 points
- all weeks, we had a hammer candlestick which had no follow through buying
- note that a hammer at a top is bearish and bullish if it occurs after a downtrend

- this week's low is 10800 where we had very good buying coming
- this becomes SL for long positions

- a lot of rangebound trading may happen before a breakout happens - let's see


BANK NIFTY technicals

- trend is down on daily charts
- Friday saw a lot of selling with trading at 1200 points plus
- some signs of buying emerging from lower levels

- my swing high remains around 28400 levels
- a lower swing high is yet to be formed

- so a buy signal will take some time to come on daily charts


The relativity of income

Profitable trading mindset

No significant correction in past 2-3 years


September 21, 2018

Swing trading signals :: 21-SEP-2018

Swing trading signals :: 21-SEP-2018

  • This report is for your personal use only and is valid for next trading day.
  • Signals are generated using the kplswing indicator.
  • Algorithm: BUY signal is generated if a stock closes above 20 days high.
  • Stock name is highlighted in case of first signal of the trend.
  • Exits: There are no targets and exits are based on a trailing stoploss. Returns are whatever the market gives - 20%, 100%, etc.
  • Stoploss: use fixed SL to limit losses and trailing SL for profit booking.
  • Trailing SL: For long positions, use weekly low or 10 days low.
  • Click on stock name link for charts, more info etc
  • Limit investment per stock to 3% of trading capital or limit loss per trade to max 1% of your trading capital.
  • Important: Trade in cash only and never in futures.
  • Liquidity filter: ||||| good liquidity - ||||| excellent liquidity. Avoid stocks with ||||| low liquidity.
This information is for your study only and is not a recommendation to buy or sell

All signals:

Buy signals: 
OIL - RAJESHEXPO -

Open positions and stoploss


StockClose% ChangeBought atBuy DateRemarksTrailing StoplossReturns %
ACC1539.60-1.54139005/07/2018Hold Long Positions150010.79
AUROPHARMA762.70-1.7165617/08/2018Hold Long Positions50016.28
CIPLA653.20-1.1262904/07/2018Hold Long Positions6203.86
CUMMINSIND684.65-5.3270303/08/2018Exit Long Positions720-2.65
GAIL390.151.4638803/08/2018Hold Long Positions3550.50
GRASIM1051.15-1.60104617/08/2018Hold Long Positions10000.51
JSWSTEEL408.00-2.1733703/08/2018Hold Long Positions38020.96
M&M959.901.1692506/07/2018Hold Long Positions9203.78
PIDILITIND1136.851.55111825/07/2018Hold Long Positions10801.72
TATASTEEL625.150.6459920/08/2018Hold Long Positions5804.30
TCS2103.151.22191306/07/2018Hold Long Positions20009.94
TECHM738.05-4.1468131/07/2018Hold Long Positions7208.42

Share this...