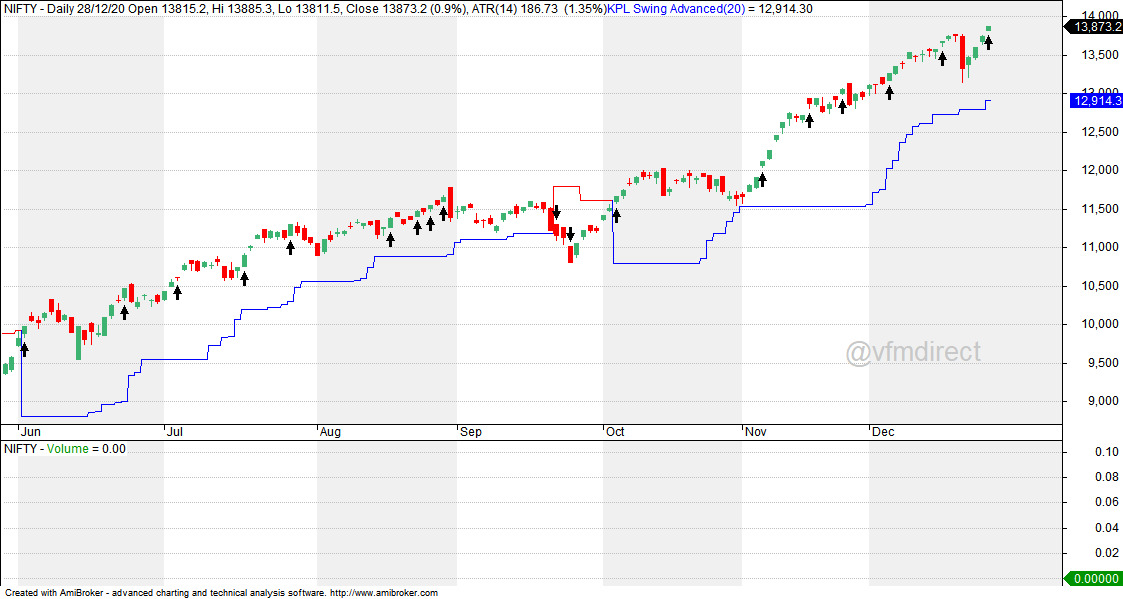
December 31, 2020

NIFTY monthly, quarterly and yearly charts

Monthly charts:
- nice breakout


Quarterly charts:
- awesome breakout
- retest of 12000 toh banta hai for those who missed this rally


Yearly charts:
- huge hanging man
- I am ignoring this now


NIFTY EOD charts

- trend is up on daily charts
- today markets closed flat
- AD was 5:4

- swing reversal level 13000


December 30, 2020

NIFTY intraday charts

5 min:


15 min:

NIFTY EOD charts

- trend is up on daily charts
- today nifty closed 0.3% in positive at 13982
- AD was flat

- swing low support 13000


How the Nifty will change in the coming decade?

20 of today’s Nifty constituents are highly likely to be booted out over the next decade. We outline how you can identify the exits (relatively easy to do) and the entrants into the Nifty (a little harder to do) over the next decade. If you are good at spotting the 20 entrants into the Nifty you are likely to deliver 40% CAGR over the next decade.

The Nifty typically churns by 40% over a ten-year period implying that 20 of the current Nifty constituents will find themselves ejected from India’s most actively traded benchmark index whilst an equal number will find themselves entering the index. If you or I can second guess some of these exits/entrants we will improve our chances of generating returns significantly higher than the long term returns of investing in the Nifty (the total returns from the Nifty were 10% per annum in the decade running upto 1st December 2019). For example, if we had taken the Nifty as it is stood a decade ago and invested only in those 30 companies which have stayed in the Nifty through the intervening ten-year period, our returns would have been 19% per annum.


December 29, 2020

NIFTY EOD charts

- trend is up on daily charts
- today nifty closed 0.4% in positive at 13933
- AD was flat

- swing low support 13000
- this is also the reversal level now


December 28, 2020

NIFTY intraday charts

5 min:


15 min:

NIFTY EOD charts

- trend is up on daily charts
- today nifty closed 0.9% in positive at 13873
- AD was 13:5

- swing low support 13000
- ATR based SL is around 13500


The anatomy of a stock market bubble staring India in the face

On 18 December, the price to earnings (PE) ratio of the Nifty 50 stock market index reached an all-time high of 37.84. This was around 87% higher than the average PE ratio of 20.26 since 1 January 1999.

The PE ratios of the Nifty 50 and other broader indices continue to remain at extremely high levels. This ratio is essentially the number of rupees that investors are ready to pay for every rupee of earnings over the last 12 months of the stocks that make up any index.

The average yearly PE ratio of the Nifty 50 has been largely rising since 2013. This basically means that share prices have risen much faster than company earnings. This is true for other indices as well. Interestingly, the overall net profit of listed companies in India hasn’t grown in many years. Their overall net profit in 2019-20 was lower than in 2007-08. Of course, 2019-20 profits would have been slightly hit by the covid pandemic, but even the overall net profit for 2018-19 was lower than that in 2010-11.

Read more at https://www.livemint.com/opinion/columns/the-anatomy-of-a-stock-market-bubble-staring-india-in-the-face-11609081382394.html 

December 27, 2020

BANKNIFTY (futures) top down analysis on multiple timeframes

Daily charts:
- trend is up but
- the Monday flash crash due to some technical error has messed up the charts
- and possibly stopped out many traders


Hourly charts:
- a buy signal has just been formed 
- SL around 30000-30200 F

How to get rich without being lucky - by Naval Ravikant

Naval Ravikant is an Indian-American entrepreneur and investor. He is the co-founder, chairman and former CEO of AngelList. He has invested early-stage in over 200 companies including Uber, FourSquare, Twitter, Wish.com, Poshmark, Postmates, Thumbtack, Notion, SnapLogic, Opendoor, Stack Overflow, OpenDNS, Yammer, and Clearview AI, with over 70 total exits and more than 10 Unicorn companies. 

Ravikant is is also a podcaster who shares advice on pursuing wealth and happiness.

Seek wealth, not money or status. Wealth is having assets that earn while you sleep. Money is how we transfer time and wealth. Status is your place in the social hierarchy. 

↓ 

Understand ethical wealth creation is possible. If you secretly despise wealth, it will elude you. 

↓ 

Ignore people playing status games. They gain status by attacking people playing wealth creation games. 

↓ 

You’re not going to get rich renting out your time. You must own equity—a piece of a business—to gain your financial freedom. 

↓ 

You will get rich by giving society what it wants but does not yet know how to get. At scale. 

Pick an industry where you can play long-term games with long-term people. 

↓ 

The internet has massively broadened the possible space of careers. Most people haven’t figured this out yet. 

↓ 

Play iterated games. All the returns in life, whether in wealth, relationships, or knowledge, come from compound interest. 

↓ 

Pick business partners with high intelligence, energy, and, above all, integrity. 

↓ 

Don’t partner with cynics and pessimists. Their beliefs are self-fulfilling. 

↓ 

Learn to sell. Learn to build. If you can do both, you will be unstoppable. 

Arm yourself with specific knowledge, accountability, and leverage. 

↓ 

Specific knowledge is knowledge you cannot be trained for. If society can train you, it can train someone else and replace you. 

↓ 

Specific knowledge is found by pursuing your genuine curiosity and passion rather than whatever is hot right now. 

↓ 

Building specific knowledge will feel like play to you but will look like work to others. 

↓ 

When specific knowledge is taught, it’s through apprenticeships, not schools. 

↓ 

Specific knowledge is often highly technical or creative. It cannot be outsourced or automated. 

Embrace accountability, and take business risks under your own name. Society will reward you with responsibility, equity, and leverage. 

↓ 

“Give me a lever long enough and a place to stand, and I will move the earth.” 

—Archimedes 

↓ 

Fortunes require leverage. Business leverage comes from capital, people, and products with no marginal cost of replication (code and media). 

↓ 

Capital means money. To raise money, apply your specific knowledge with accountability and show resulting good judgment. 

↓ 

Labor means people working for you. It’s the oldest and most fought-over form of leverage. Labor leverage will impress your parents, but don’t waste your life chasing it. 

Capital and labor are permissioned leverage. Everyone is chasing capital, but someone has to give it to you. Everyone is trying to lead, but someone has to follow you. 

↓ 

Code and media are permissionless leverage. They’re the leverage behind the newly rich. You can create software and media that works for you while you sleep. 

↓ 

An army of robots is freely available—it’s just packed in data centers for heat and space efficiency. Use it. 

↓ 

If you can’t code, write books and blogs, record videos and podcasts. 

↓ 

Leverage is a force multiplier for your judgment. 

↓ 

Judgment requires experience but can be built faster by learning foundational skills. 

There is no skill called “business.” Avoid business magazines and business classes. 

↓ 

Study microeconomics, game theory, psychology, persuasion, ethics, mathematics, and computers. 

Reading is faster than listening. Doing is faster than watching. 

↓ 

You should be too busy to “do coffee” while still keeping an uncluttered calendar. 

↓ 

Set and enforce an aspirational personal hourly rate. If fixing a problem will save less than your hourly rate, ignore it. If outsourcing a task will cost less than your hourly rate, outsource it. 

↓ 

Work as hard as you can. Even though who you work with and what you work on are more important than how hard you work. 

Become the best in the world at what you do. Keep redefining what you do until this is true. 

↓ 

There are no get-rich-quick schemes. Those are just someone else getting rich off you. 

↓ 

Apply specific knowledge, with leverage, and eventually you will get what you deserve. 

↓ 

When you’re finally wealthy, you’ll realize it wasn’t what you were seeking in the first place. But that is for another day. [11] 


Summary: Productize Yourself 

Source: https://www.navalmanack.com/almanack-of-naval-ravikant/understanding-how-wealth-is-created

December 24, 2020

NIFTY intraday charts

5 min:


NIFTY EOD charts

- trend is up on daily charts
- today nifty closed 1% in positive at 13749
- AD was 5:2

- with today's move, all losses from Monday's flash crash (technical glitch) are recovered

- if not already stopped out, your SL is now 13000

- note in last 2-3 single big red bar corrections,
- there was no follow thru selling and markets made new highs
- this time it looks no different


December 23, 2020

NSE Clearing suffered a tech glitch before Nifty fell by 3% on Monday

NSE Clearing, the trade-clearing and settlement arm of the National Stock Exchange (NSE), was hit by a ‘technical glitch’ on Monday that affected several stock brokers, sources in the know told BusinessLine.

Before the Nifty index witnessed its worst single day fall of over 3 per cent, or 432 points, in nearly seven months , many brokers saw their trade orders being automatically deleted and some even had their terminals disabled, brokers said.

“At around 11.38 AM, all our pending orders were cancelled by the exchange. Market regulator SEBI should look into this as to how it happens on the day volatility is high,” a dealer at a south-Mumbai brokerage house said.

At around 11.30 AM, the Nifty index was trading at 13,722 levels. But in less than three hours around 2.45 PM, the index crashed to 13,212. According to brokers, the orders pending in the system at lower levels often act as a cushion for the markets during severe price fall. However, since pending orders of several brokers were ‘automatically’ deleted the selling seemed intense, brokers said. 

Read more at https://www.thehindubusinessline.com/markets/stock-markets/nse-clearing-suffered-a-tech-glitch-before-nifty-fell-by-3-on-monday/article33396349.ece

Long term investing beautifully explained


December 22, 2020

NIFTY intraday charts

5 min:


15 min:

NIFTY EOD charts

- trend is up on daily charts
- but long positions may have been stopped out
- today nifty closed 1% in positive at 13466
- AD was 5:4

- some bit of history
- circled area shows recent corrections
- these have been one day events with no follow thru selling
- let us see if history repeats


December 21, 2020

US Dollar monthly chart

- there has been inverse correlation with nifty
- current trend is down and nifty has rallied smartly
- now good support around 88
- above 92, expect a blast and a deeper correction in nifty

- note today's fall in nifty is matched with a strong rally in the USD index


NIFTY intraday charts

5 min:
- crazy correction/ function
-  300 point fall in 5 min


NIFTY EOD charts

- today was a huge range expansion day
- nifty closed 3% in red at 13328
- trading range was 600 points

- intraday fall at one time was 300 points in 5 min

- AD was 1:10
- VIX jumped 24% to 23

- in the past, these red bars have been a one day correction
- afterwards there was minimal price correction mostly time based correction
- will history repeat?

- kplswing indicator says trend is still up
- but today's price action would have stopped out where SL was 5 day low
- 10 day low SL is around 13200


Dollar Index and NIFTY correlation

NIFTY PE ratio at 37... will markets crash?


Trading Psychology


December 16, 2020

NIFTY EOD charts

- trend is up on daily charts
- today nifty closed 0.8% in positive at 13682
- AD was 3:2

- PE ratio at 38
- apart from above, everything looks nice and rosy/ fair


December 15, 2020

Financial Freedom


NIFTY intraday charts

5 min:
- short trade was breakeven
- long trade was loss due to tight SL


15 min:

NIFTY EOD charts

- trend is up on daily charts
- today nifty closed flat at 13568
- AD was flat

- option writers expect 13000 to hold this month


December 14, 2020

NIFTY intraday charts

5 min:
- no trades today
- region of   13400-13450 is good support area


15 min:

NIFTY EOD charts

- trend is up on daily charts
- today nifty closed 0.3% in positive at 13558
- AD was 2:1

- trailing SL around 13000
- per option writing clues, this level is not expected to break this month.


December 12, 2020

NIFTY weekly charts

- trend is very clearly up
- not once did we have a lower high lower low candlestick
- and the overall breadth so far has been excellent.

- since we are at all time highs, there is no resistance
- support 13000

- note nifty is up for 6 consecutive weeks
- contribution from RELIANCE has been zero as stock has been declining for more than 6 weeks
- so what will happen if this stock starts moving up/ new highs?


BANKNIFTY technicals

- trend is up from Oct
- last month the index gained 24%
- trailing SL at     29000


On believing "experts"


December 11, 2020

NIFTY intraday charts

Note:
- exit signal for long trades on 30 min charts
- on hourly charts, this will happen on close below 13400 F

5 min:


NIFTY EOD charts

- trend is up on daily charts
- today nifty closed 0.3% in positive at 13514
- AD was 3:2

- trailing SL around 13000


December 10, 2020

NIFTY intraday charts

5 min:


NIFTY EOD charts

- trend is up on daily charts
- today nifty closed 0.4% in negative at 13478
- AD was 1:2

- trailing SL around 13000

- nifty over bought for some time... sign of strength


Expanding triangle in S&P 500


NASDAQ bar reversal

- we had many of these in the past and nothing happened
- it was at best a 1-2 day correction before the rally resumed
- will it be different this time?


December 9, 2020

NIFTY intraday charts

5 min:


NIFTY EOD charts

- trend is up on daily charts
- today nifty closed 1% in positive at 13529
- AD was 3:2

- trailing SL at 13000 (10 day low at 12800)

- though markets are rising, VIX is refusing to come down much
- today it was up 5% at one time but closed 2% up at 19


December 8, 2020

How easy or difficult is it to time the markets

Recd as a forward...


NIFTY intraday charts

5 min:


15 min:

NIFTY EOD charts

- trend is up on daily charts
- today nifty closed 0.3% in positive at 13393
- AD was flat

- trailing SL now at 13000


December 7, 2020

How long will these valuations sustain?

- as of now, everything looks nice and rosy
- good broad based rally in stocks
- returns of 2x to 4x in past few months
- no meaningful correction
- but PE ratio is stubbornly high


NIFTY intraday charts

- today I have posted charts with N=20 (my fav setting) and with SL at N=10
- note I prefer N=5 as SL

Warning:
- never try chart-fitting or trying to find a combination which gives "best results"
- markets never move in a easy/ linear manner

5 min:


NIFTY EOD charts

- trend is up on daily charts
- today nifty closed 0.7% in positive at 13356
- AD was 3:1

- 5 day trailing SL now roughly at 13000
- and 10 day low around 12700


December 6, 2020

NIFTY weekly charts

- I expected nifty to reverse from the trendline resistance
- this did not happen
- trend still remains strongly up
- my trend reversal level still remains 12500


BANKNIFTY EOD and hourly charts

Daily charts
- trend is up on daily charts
- this index was earlier underpeforming the nifty is now doing well
- consolidation has set in for past few days
- swing low SL around 28500

- recent all time high is around 32400


Hourly charts (futures)
- sustaining above 30000 will be bullish
- SL below 29500

December 4, 2020

INDIAVIX daily and weekly charts

Daily chart:
- past few months, support around 15
- note this is not a support or resistance issue
- just that when VIX drops, writers are reluctant to write options at lower IVs


Weekly charts:
- here lower range is 10
- formed since 2017
- options are unlikely to get cheaper than this

NIFTY intraday charts

5 min:
- traded both long and short
- missed the last buy signal

- in hindsight, region around 13200 F was excellent buy area
- this would have also given super gains in options as risk was low


15 min:
- support 13200 clearly visible

NIFTY EOD charts

- trend is up on daily charts
- today nifty closed 1% in positive at 13259
- AD was 5:4

- a close at weekly / Friday highs is bullish for next week.

- lot of sector rotation happening
- earlier IT and Pharma stocks rallied, now they are quiet
- sectors which did not move earlier (banking, auto) are now moving fast
- and the merry go round thus continues


December 3, 2020

Breakout likely in NIFTY 50 USD charts


Bill Ackman - Massive pent up demand - 2021 will be 'very, very good year'

Bill Ackman estimated that consumers are sitting on a colossal sum of up to $US3 trillion of savings.

People aren’t eating out, they’re not going on vacation, they’re not driving“, he pointed out.

It is elementary that when the restrictions are eased, consumers will go on a rampage and spending binge.

When you keep someone locked down, their next move when they can actually feel safe is going to be to go on a vacation, to go drinking, to go to dinner, to go to a show,” he stated.

It’s probably the single greatest time in history to open a restaurant,” he added.

It is obvious that the forthcoming quarterly results of companies as well as the GDP growth of Countries will be very strong due to the surge in spending by consumers. 

Read more at https://www.sohnheartsandminds.com.au/media/bill-ackman-says-go-long-2021-will-be-very-very-good-year

Best advice ever given in this correction

- SIP investment advice in this correction around 10000 levels has given a 30% return this year
- 10000 to 7500 and now to 13000+
- cannot remember last when we had such excellent gains

- I have been recommending investment in index funds for more than a decade
- no fund manager can beat the market so better to be the market

- you cannot time the market but you can be a disciplined investor at all levels.


Share this...