Showing posts with label banknifty. Show all posts

May 24, 2021

BANKNIFTY EOD chart

- trend is up
- support 31900
- resistance 35000

- ATH 37500


May 5, 2021

BANKNIFTY EOD charts

- overall trend is down
- but net move in past 3 months is insignificant
- this year started with open at 32600 (approx)
- and today close is 32800


April 22, 2021

BANKNIFTY EOD charts

- index takes support around 30000-30500 levels
- BNF was up 2.2% today

- overall trend is still down 
- swing high/ resistance around 32500


April 20, 2021

BANKNIFTY EOD charts

- this index has been weak for some time
- very good support around 30000
- bullishness possible above 32500


April 12, 2021

BANKNIFTY EOD charts

- trend is still down
- supports 30000-25000

- this index has been weak for some time


April 10, 2021

BANKNIFTY weekly charts

- BNF had resistance around 32500
- this year, it gave a nice breakout and is now consolidating
- now BNF is back to 32500 levels


March 27, 2021

BANKNIFTY weekly charts

- signs of buying seen at lower levels
- prev resistance/ top of 2019/2020 provides support now
- weekly close below 32400 will be negative

- note: on daily charts, trend is down


March 17, 2021

Sell signal on BANKNIFTY

- index closed below its recent swing low
- reversal level is 37500
- next support 32500


February 8, 2021

BANKNIFTY EOD chart

- trend is up
- breakout level was 32500
- this level should provide support

- swing low 30000


December 27, 2020

BANKNIFTY (futures) top down analysis on multiple timeframes

Daily charts:
- trend is up but
- the Monday flash crash due to some technical error has messed up the charts
- and possibly stopped out many traders


Hourly charts:
- a buy signal has just been formed 
- SL around 30000-30200 F

December 18, 2020

December 12, 2020

BANKNIFTY technicals

- trend is up from Oct
- last month the index gained 24%
- trailing SL at     29000


December 6, 2020

BANKNIFTY EOD and hourly charts

Daily charts
- trend is up on daily charts
- this index was earlier underpeforming the nifty is now doing well
- consolidation has set in for past few days
- swing low SL around 28500

- recent all time high is around 32400


Hourly charts (futures)
- sustaining above 30000 will be bullish
- SL below 29500

November 9, 2020

BANKNIFTY breakout

 - next resistance 28000-30000


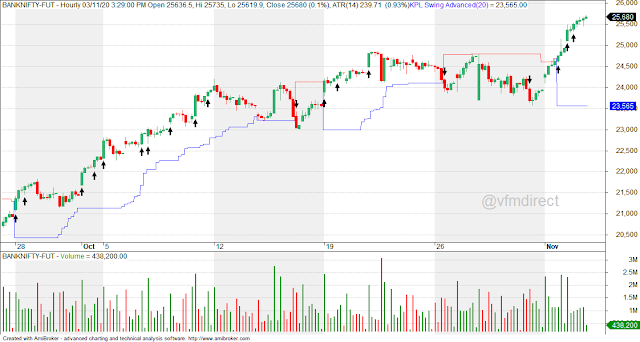
November 3, 2020

October 31, 2020

BANKNIFTY weekly charts

- BNF has underperformed NIFTY massively
- not able to sustain above 24000 

- resistance 25000


September 30, 2020

September 5, 2020

BANKNIFTY weekly charts

- index could not sustain above 24000 
- below 22000 more weakness


Share this...