July 31, 2019

NIFTY monthly charts:

- market is sideways
- on 31-JAN-2018, nifty closed at 11028
- today it is at 11118 ... a net move of 90 points

- support 11000-10000
- resistance 12000

FM has commented on matter of immense importance

Market outlook

Daily charts:
- trend is down on daily charts
- today nifty closed 0.3% in positive at 11118
- AD was flat

- nifty took support around 11000... low was 10999.4
- note breakout above 11000 was attempted 3-4 times over 4 months
- so let us see how long this support holds

- between 11700 and 11000, there is no swing high
- formation of one is not necessary
- but if formed, will help traders set SL
- in absence of any swing high, we can assume one at 50% fall - 11350

- today, 588 stocks made new 52 week lows

July 30, 2019

Truecaller UPI scam

Market outlook

Daily charts:
- trend is down on daily charts
- today nifty closed 1% in negative at 11085
- AD was 2:7

- 500+ stocks closed at new 52 week lows... capitulation?
- midcaps and smallcaps undergoing a lot of pain

- support 10600-11000 resistance 11500

Random events have a far greater effect than you can imagine

No... you have not failed #VGSiddhartha

You have created 50000+ jobs and these jobs have supported families.

You have taken risks as only  an entrepreneur can. You have skin in the game.

Politicians and bureaucrats do not have skin in the name.


July 29, 2019

NIFTY PE ratio chart


Market outlook

Daily charts:
- trend is down on daily chart
- today nifty closed 0.8% in negative at 11189
- AD was 5:13 (slightly worse than 1:2)

- VIX up 8%

- very good support around 11000-11100

July 27, 2019

BANK NIFTY technicals

- trend is down as crucial support broken this month
- next support 28500
- I expect buying to come in at lower levels


July 26, 2019

Market outlook

Daily charts:
- trend is down on daily charts
- today nifty closed 0.3% in positive at 11284
- AD was 5:4

- VIX down 6%

- today 290+ stocks made new 52 week lows

- option writing support 11200

July 25, 2019

DHFL ... from 700 to 55... wonder who is buying all the way down


This is what a multibagger looks like ..


EICHER retesting 2015 low/ support


TVSMOTORS down 50% now retesting crucial support


M&M testing 4-5 year support


MARUTI trading below crucial support on monthly charts


BOSCH breaks 4 year support


CASTROL at 5 year low

Market outlook

Daily charts:
- trend is down on daily charts
- today markets closed flat at 11252
- AD was 4:5

- very good support around 11000-11100

- today 300+ stocks made new 52 week lows

NIFTY trendline on monthly chart (log scale)


I just came to deposit money in my account..


This has been a true experience with ICICI Bank years ago. That time, I used to invest 50K pa in 5 year tax saving FD. Every single trip would lead to meeting with some executive, then some manager trying their best to convince me to put the money in some insurance linked savings scheme. This went for 3-4 years till this process was shifted online.

July 24, 2019

Market outlook

Daily charts:
- trend is down on daily charts
- today nifty closed 0.5% in negative at 11271
- AD was 1:2 (not bad)

- VIX down 5% (very good)

- strong support 11000-11200 region
- option writers bullish this level will hold in AUG series

RELINFRA and RELCAP to exit F&O list

HIgher the rise... harder you fall

Mid caps and small caps busted

Small and retail investors aren’t just the only casualties. Some portfolio management services, too, fell prey to the mid- and small-cap lure. Now, as most of these stocks have no liquidity, one star fund manager of a portfolio management service offered, instead, to return shares to his clients because he can’t sell them.

So much is the pain in the mid-cap sector that since January 2018 investors have lost more than ₹28 trillion in all the corrected stocks. The BSE MidCap and the BSE SmallCap indices lost 21% and 30.7%, respectively, since January 2018.

....

Noted market expert Shankar Sharma recently tweeted: “A handful of Nifty stocks is masking the ugly truth that the Indian market, now and over the last 18 months, has been far, far worse than the 2008 meltdown in terms of price damage."

Read more at https://www.livemint.com/market/stock-market-news/mid-cap-mayhem-long-road-to-recovery-1563819716599.html

Hot stocks and charts

APOLLOTYRE
APOLLOTYRE chart

NSE Advance Decline Line Chart

Financial inclusion - GST fraud version

July 23, 2019

Time is a great teacher......

Image

Image

Market outlook

Daily charts:
- trend is down on daily charts
- today nifty closed flat at 11331
- AD was flat

- today 280 stocks made new 52 week lows

- option writing support 11300 resistance 11400

Achhe Din 2.0

Image

July 22, 2019

Market outlook

Daily charts:
- trend is down on daily charts
- today nifty closed 0.7% in negative at 11337
- AD was 1:2 (not bad)

- but 460 stocks made new 52 week lows! this is bad

- option writers feel 11300 will hold this week... let's see

Lieutenant Indra Lal Roy - India's only World War 1 fighter pilot/ ace

Indra Lal Roy in his Royal Flying Corps uniform
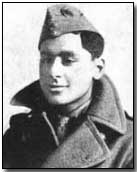
Indra Lal Roy (2 December 1898 – 
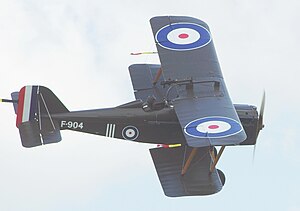
22 July 1918) is the sole Indian World War I flying ace. He is designated as First Indian Fighter Aircraft Pilot. While serving in the Royal Flying Corps and its successor, the Royal Air Force, he claimed ten aerial victories; five aircraft destroyed (one shared), and five 'down out of control' (one shared) in just over 170 hours flying time.


Roy was killed over Carvin on 22 July 1918 in a dog fight against the Fokker D.VIIs of Jagdstaffel 29. He is buried at Estevelles Communal Cemetery, Pas-de-Calais, France

Awards and honours

Roy was posthumously awarded the Distinguished Flying Cross (DFC) in September 1918 for his actions during the period of 6–19 July 1918. He was the first Indian to receive the DFC. His citation read:

"A very gallant and determined officer, who in thirteen days accounted for nine enemy machines. In these several engagements he has displayed remarkable skill and daring, on more than one occasion accounting for two machines in one patrol. (20 September 1918)[16]

In December 1998, to mark the 100th anniversary of his birth, the Indian postal service issued a commemorative stamp in his honour


My notes: the fighter planes of that era were rudimentary at the best. Not more than 8-10 instruments, no pressurisation, not sure if radio was there, no ejection system.

You can read more about the plane at https://en.wikipedia.org/wiki/Royal_Aircraft_Factory_S.E.5

SE5A at Old Warden.jpg

A probabilistic mind-set pertaining to trading consists of five fundamental truths.

A probabilistic mind-set pertaining to trading consists of five fundamental truths: 

1. Anything can happen.

2. You don’t need to know what is going to happen next in order to make money

3. There is a random distribution between wins and losses for any given set of variables that define an edge.

4. An edge is nothing more than an indication of a higher probability of one thing happening over another.

5. Every moment in the market is unique

July 21, 2019

NIFTY weekly charts

- trend is up
- support 11000
- markets can spend several weeks/ months at this level


BANK NIFTY charts

Daily charts:
- trend is down
- a crucial support broke decisively this Friday
- next significant support 28500
- this corresponds to roughly 11000 region on nifty

July 19, 2019

Market outlook

Daily charts:
- trend is down on daily charts
- today nifty closed 1.5% in negative at 11420

- AD was 1:3 ... this is actually not bad

- I am discarding channel view from here on
- reason is break of lower trendline without retest of upper trendline

- note gap between 11400 and 11600 is filled
- I don't know if this can be considered as a bullish sign

- overlapping moves as seen in June and July (so far) are corrective moves
- trending moves are usually fast

Self goal of the highest order

BANKNIFTY hourly charts

- trading in rectangle / height 500 points
- support 30300
- resistance 30800
-31200 (if breakout happens)

NIFTY futures channel on hourly charts

- expect lower trendline to provide support
- resistance 11650

July 18, 2019

Market outlook

Daily charts:
- trend is down on daily charts
- today nifty closed 0.8% in negative at 11597
- AD was 5:13

- 16 stocks made 52 week highs  and 258 stocks made new 52 week lows

What happens to the Aadhar card when the holder passes away? And the risks involved

UIDAI has not built any process or technology to handle an Aadhaar holder’s death. There are multiple issues that arise from this inability of UIDAI to handle death.


Now, have you wondered what happens to someone’s mobile number once they pass away? Telecom companies deactivate a phone number after 90 days of no usage, and then may assign it to new subscribers after a month or so. In essence, a dead person’s phone number may get assigned to a new person within 4–6 months. (The same reassignment policy applies for anyone who stops using their phone number, dead or alive.)

We know that Aadhaar numbers have a mobile number mapped with them in the UIDAI database, and is used by UIDAI for sending OTPs during authentication. Hence, the phone number owned by a dead person (and updated in UIDAI records) may get assigned to someone else six months after their death, but UIDAI will never find out that this phone number no longer belongs to that dead person.

Read more at https://medium.com/karana/death-of-an-aadhaar-64fb38be07c8

India heading to a debt trap?

Are you a rent seeker or risk taker?


July 17, 2019

Market outlook

Daily charts:
- trend is down on daily charts
- today nifty closed 0.2% in positive at 11687
- AD was flat

July 16, 2019

Channel on nifty futures chart

- just observed channeled movement in nifty fut 30 / 60 min charts
- channeled moves are usually a correction to prev move
- if channel holds, expect sluggish movement for some more time
- a fast breakout above 11700 can render channel invalid

Market outlook

Daily charts:
- trend is down on daily charts
- today nifty closed 0.6% in positive at 11661
- AD was flat

- selloff continues in broader market
- but VIX fell by almost 3%

July 15, 2019

Market outlook

Daily charts:
- trend is down on daily charts
- today nifty closed 0.3% in positive at 11588
- AD was 1:2

- midcaps and smallcaps continued to correct

- 16 stocks made new 52 week highs and 200+ stocks made 52 week lows

The only to reliably make money in the stock market


Source: http://alphaideas.in


July 14, 2019

Welcome the new Bhartiya Janta Congress Party

Did you vote BJP this time or Congress?

Don't worry... everything is fair in politics... there are no permanent enemies, only common interests... your ideology, criminal background, corruption abilities, principles etc simply does not matter.

Just see the tamasha... elected Karnataka representatives want to defect to BJP, Congress MLAs in Goa have already joined BJP ... Maharashtra next?

The voters always get taken for a ride... fact of life.


DHFL may not survive as a ;going concern'?

Wonder who is buying from 500 levels to below 100 now.... trend is so clearly down.


Read more at https://economictimes.indiatimes.com/markets/stocks/news/dhfl-warns-investors-it-may-not-survive-as-a-going-concern/articleshow/70212838.cms

July 12, 2019

Market outlook

Daily charts:
- trend is down on daily charts
- today nifty closed 0.3%  in negative at 11553

- AD was flat
- 11 stocks made 52 week highs and 160 stocks made 52 week lows

- nifty still trading within channel

- VIX down 4% ... complacency?

- a breakout above 11600 was sold into

BALAJI AMINES.. funny recommendation by HDFC

Bleak future ahead... still given buy reco on 20-MAY at 439 with TGT 525


See blue arrow.......Stock has lost 100 points since then!!!

July 11, 2019

Market outlook

Daily charts:
- trend is down on daily charts
- today nifty closed .7% in positive at 11583
- AD was flat ... why?

- 14 stocks made 52 week highs and 176 stocks made 52 week lows

- VIX down 8%... why?
- does this mean no fear of any downside?
- or expectation of rangebound markets?

July 10, 2019

Market outlook

Daily charts:
- trend is down on daily charts
- today nifty closed 0.4% in negative at 11498
- AD was 6:11

- next deep support area 11000-11000

- today something interesting happened
- VIX increased initially and later dropped after 12pm
- so markets were going down but option prices did not increase
- this usually happens when a bottom is nearby
- let's see... before the budget also VIX dropped but still markets tanked

July 9, 2019

If it moves, tax it... desperate India

The government is targeting foreign investors, high-earning employees and companies to plug its fiscal gap. Such overreach never ends well.

Desperation is creeping into India’s economic policy-making. Having lost the fiscal plot, bureaucrats are trying to marshal resources by squeezing taxpayers, foreign investors, firms planning buybacks and even the central bank. Such overreach never ends well.

Tax collections last year were a full 1 percentage point of GDP lower than the 7.9 per cent the government had hoped to obtain. Rathin Roy, director of the New Delhi-based National Institute of Public Finance and Policy, describes the situation as an “unstated fiscal crisis.” Instead of confronting the sober reality, revamping a flawed goods and services tax, and taking steps to pull the economy out of a synchronized slowdown in consumption and private investment, bureaucrats are trying to make up the revenue shortfall by taxing everything that moves.

Read more at https://www.business-standard.com/article/economy-policy/if-it-moves-tax-it-desperation-creeps-into-indian-economic-policy-making-119070900359_1.html

Market outlook

Daily charts:
- trend is down
- today nifty closed flat at 11556
- AD was flat

- 10 stocks made 52 week highs and 196 stocks made 52 week lows

July 8, 2019

Market outlook

Daily charts:
- trend is down on daily charts (wef today)
- first warning came on hourly charts on Friday
- today markets closed 2.14% in negative at 11559
- AD was 2:7

- I have drawn one channel
- let us see if markets trade within the channel or break lower trendline
- if markets continue trading within channel, there will be whipsaws

- one thing is clear
- 11800 to 12000 is distribution zone
- recall all my prev posts about nifty PE being 28+
- and other posts showing rally lacked broader market participation

Average intelligence is enough for successful trading


July 7, 2019

Hot stocks and charts

LAST updated: 05-JUL-2019 
BPCL
BPCL chart

July 6, 2019

Market Wizard Linda Raschke’s Technical Trading Rules


  1. Buy the first pullback after a new high. Sell the first rally after a new low.
  2. Afternoon strength or weakness should have follow through the next day.
  3. The best trading reversals occur in the morning, not the afternoon.
  4. The larger the market gaps, the greater the odds of continuation and a trend.
  5. The way the market trades around the previous day’s high or low is a good indicator of the market’s technical strength or weakness.
  6. The previous day’s high and low are two very important “pivot” points, for this was the definitive point where buyers or sellers came in the day before. Look for the market to either test and reverse off these points, or push through and show signs of continuation.
  7. The last hour often tells the truth about how strong a trend truly is. “Smart” money shows their hand in the last hour, continuing to mark positions in their favor. As long as a market is having consecutive strong closes, look for up-trend to continue. The up trend is most likely to end when there is a morning rally first, followed by a weak close.
  8. High volume on the close implies continuation the next morning in the direction of the last half-hour. In a strongly trending market, look for resumption of the trend in the last hour.
  9. The first hour’s range establishes the framework for the rest of the trading day.
  10. A greater percentage of the day’s range occurs in the first hour then was the case in the past, and thus it has become increasingly important to trade aggressively if there are early signs of a strong trend for the day.
  11. In the world of money, which is a world shaped by human behavior, nobody has the foggiest notion of what will happen in the future. Mark that word – Nobody! Thus the successful trader does not base moves on what supposedly will happen but reacts instead to what does happen.


Rs 4 lakh crore share sale coming to D-street

Option buyers get STT relief, trading a lift

NIFTY weekly charts

- trend is up
- this week nifty closed flat
- entire selling happened on Friday

- stiff resistance seen around 12000 zone
- not a single weekly close has happened above 12K
- the day it happens, expect a min rally of 10-15%

- below 11600 more correction possible

BANK NIFTY technicals

- index is rangebound
- support 30000 resistance 32000
- index is trading near top of the range

July 5, 2019

Market outlook + Budget day analysis

Daily charts:
- today was budget day
- typically these days one sees a lot of volatility
- right enough, markets opened flat but lost 180 points intraday
- (adjusted) close was however 1.1% in negative at 11811
- AD was 5:13

- the level of 11800 is important as it has offered support in the past

- today was also the last day of the week
- and the 5th week when nifty attempted to close above 12000 but could not
- so 12000 becomes a very important swing level

- note today's red bar was the biggest this week and "engulfed" prev 4 day gains
- this means there is a high chance of trend changing to down

- but as markets are rangebound, I will wait for close below 11600
- unless a higher swing low forms

- hourly charts will give signal first for trend reversal

- surprise - vix down actually down 4% so no fear?


Increase public holding from 25% to 35% ... flood of selling?


July 4, 2019

Market outlook

Daily charts:
- trend is up on daily charts
- today nifty closed 0.25% in positive at 11947
- AD was flat

- option writing support 11500 resistance 12000-12500

- today 20 stocks made 52 week highs and 90 stocks made 52 week lows

Nouriel 'Dr. Doom' Roubini predicts recession in 2020

Never trust predictions... specially if it comes from a "noted" economist or some professor!


Read more at https://www.moneycontrol.com/news/business/markets/nouriel-dr-doom-roubini-predicts-recession-in-2020-4163901.html

Dish TV promoters may sell 58% stake to Bharti arm, Warburg Pincus for about Rs 5,000cr

Stock has corrected from 100 to 65 and now to 30.... If the promoters had sold few months ago, they could have easily got 10 to 15K crores....


Read more at https://www.moneycontrol.com/news/business/dish-tv-promoters-may-sell-58-stake-to-bharti-airtel-warburg-pincus-for-about-rs-5000cr-4167891.html

July 3, 2019

Stocks gaining more than 5%

DHFL - DISHTV - IBULHSGFIN - IBVENTURES - ITI - PRESTIGE - RUSHIL -

Market outlook

Daily charts:
- trend is up on daily charts
- today nifty closed flat at 11917
- AD was 5:4

- VIX dropping down almost everyday
- will budget be a non event?

- swing low 11600 resistance 12100

India's first ever budget


July 2, 2019

Stocks at 52 week highs

ADANIPOWER - BAJFINANCE - BRIGADE - CESC - EMMBI - HDFC - HDFCBANK - 

REFEX - RELAXO - SBILIFE - SBIN - SIEMENS - SRF - TDPOWERSYS -

TORNTPOWER - TRENT - VBL -

Market outlook

Daily charts:
- trend is up on daily charts (wef today)
- now I will consider trend reversal only if markets close below 11600

- today nifty closed 0.4% in positive at 11910
- a small hanging man was formed (not significant)
- AD was flat at 8:9

- support 11600 resistance 12100

Fresh investments plunge to a 15-year low

Indian companies, across both private and public sectors, announced new projects worth ₹43,400 crore in the June 2019 quarter, 81% lower than what was announced in March quarter and 87% lower than the same period a year ago.

..........

According to CMIE data, private sector projects are being stalled at unprecedented rates. The stalling rate is calculated as a percentage of the total projects under implementation so that the values are comparable across time. The stalling rate of private sector projects, which has hovered above 20% since the September 2017 quarter, reached an all-time high of 26.1% in the June 2019 quarter. Within sectors, the manufacturing and power sectors have suffered the most with stalling rates of 27.2% and 20.4%, respectively. They along with the service sector contribute to 92% of the total stalled projects.


Read more at https://www.livemint.com/news/india/new-investment-plunges-to-a-15-year-low-1561976363936.html

July 1, 2019

The Valuations Perspective

Market outlook

Daily charts:
- trend is down on daily charts
- today nifty closed 0.7% in positive at 11866
- AD was flat ... why?

- swing low 11600 high 12100

Share this...