July 31, 2015

Market outlook

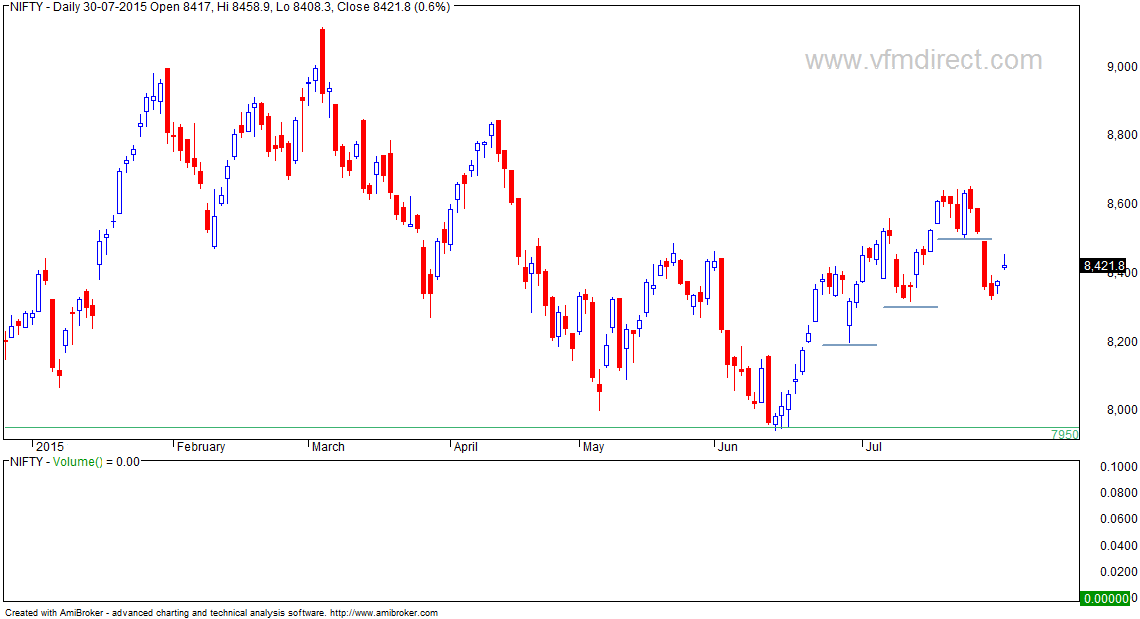
- markets close nicely in positive
- advance decline positive but average
- VIX drops by 4%
- option writing support at 8200 and resistance 8800
- daily trend will turn bullish above 8650
- expecting continuation of rangebound movement for some time.


NIFTY futures intraday charts

- breakout above yesterday's high was buy signal
- another buy signal came around 11 am
- cover at close; good profit

July 30, 2015

Hot stocks and charts

LAST updated: 30-JUL-2015 
  • These charts are for educational purposes only.
  • This is not a recommendation to buy or sell
  • Follow the trend... if stock is above last month's high, trend is up and vice versa.
  • Golden stoploss: min 10% or last month's low (long position).
  • Never risk more than 1% of your capital on any trade.
  • All charts are provided by icharts.in
AARTIDRUGS
AARTIDRUGS chart

Market outlook

- markets open gapup but close near open
- advance decline positive
- immediate support 8300 resistance 8500 spot
- option writing support at 8200


NIFTY futures intraday charts

- breakout above yesterday's high was buy signal (first green arrow for today)
- those using solely today's chart would have got buy signal on second green arrow.
- trailing SL resulted in small profit in first case and no profit no loss in second case


July 29, 2015

US dollar collapse - videos

Lots of interesting videos on this - now it is not surprising that this will happen sometime or the other but what is interesting is the dramatization.

Consider this as advance weekend fun or if you are serious, start securing yourself.

In other words, manage the risk in whatever you do.

Hot stocks and charts

LAST updated: 29-JUL-2015 
  • These charts are for educational purposes only.
  • This is not a recommendation to buy or sell
  • Follow the trend... if stock is above last month's high, trend is up and vice versa.
  • Golden stoploss: min 10% or last month's low (long position).
  • Never risk more than 1% of your capital on any trade.
  • All charts are provided by icharts.in
ABG SHIPYARD
ABG SHIPYARD chart

NMDC down 28% this year

- stock is down 28% this year
- all time high was 556 in 2010
- stock never crossed 240 in past 3-4 years
- now lifetime low at 92 (2013)
- let's see what happens here.

Similar story (and worse) is in PSU banks, metal stocks.

Market outlook

- a rangebound trading day
- markets traded within yesterday's hi/ lo
- advance decline positive.
- most likely expiry likely to be within 8300 and 8400
- next series option writing support 8200.


NIFTY futures intraday charts

- first bar sets the range
- nothing to do whole day


Hourly charts show support and resistance levels.


TATAMTDVR technicals

Stock is trading near 52 week lows... trend is still down and there is no buy signal.

Trading above 260 will be bullish.

See charts

US markets poised for new highs?


DJIA has an expanding triangle - this has bullish implications


Excellent post on algorithmic trading in India

The arrest of a London based algorithmic trader, Navinder Singh Sarao, on charges of triggering the US flash crash of 2010 has once again brought regulatory concerns on high frequency trading (HFT) to the forefront. With the underlying fear that the use of high speed complex algorithms can pose systemic risk, regulators worldwide are considering actions to tighten their grip on HFT. The Indian securities markets have not remained immune to such concerns, and the securities market regulator, SEBI, has indicated that steps will be taken to keep the level of algorithmic trading (AT) in check. Very recently, even RBI in its annual Financial Stability Report expressed its concerns regarding high levels of algorithmic orders in the Indian securities market.

Despite all the fears and the measures that are being taken to curb HFT, one needs to note that the evidence regarding how HFT (or AT) hurts the market is yet to be established. Concerns such as higher percentage of algorithmic orders creates higher level of systemic risk in the financial system are not backed by strong empirical evidence. Studies examining AT/HFT trading only find evidence contrary to this popular notion (Brogaard et al., 2015; Thomas and Aggarwal, 2014). Other studies (Biais and Faoucault, 2014) examining the overall effect of AT/HFT on market quality find that higher levels of AT/HFT improves market quality by increasing liquidity and price efficiency. In spite of this overwhelming evidence on the effect of AT, regulatory fears on how increased market complexity can disrupt the financial markets remain.

Read complete article at http://ajayshahblog.blogspot.in/2015/07/the-changing-landscape-of-equity-markets.html

July 28, 2015

The naked truth about PSU banks

India’s public sector banks have no place to hide—they stand in full public glare.
Three large state-owned banks announced their June quarter earnings on Tuesday. Punjab National Bank, the largest among them, announced a 48% drop in net profit. Bank of India fared worse. Its net profit plunged 84%, after posting a loss in the previous quarter.
Another Mumbai-based bank, Union Bank of India, posted a 22% drop in profit in the June quarter.
The reason behind such a dismal performance?

Correlation between portfolio size and expected retrurns

Excellent article on pros and cons of different portfolio sizes.

By alpha architect

Each month, we select the largest 1,000 U.S. stocks to form our universe. We then randomly form portfolios as follows:

  • Portfolio with 15 stocks.
  • Portfolio with 50 stocks.
  • Portfolio with 100 stocks.
  • Portfolio with 300 stocks.
  • Portfolio with 500 stocks.

HINDZINC support

Stock is close to support which is already tested 4-5 times....


And this is the monthly chart

CASTEXTECH 11 days lower circuit

Everything looks fine when stocks like these go up... from 60 to 360 in less than 4 months and that with decent volumes.

Till the time the stock starts correcting and keeps hitting lower circuit for 11 consecutive days.

Average volume? less than 500 shares a day.

Beware of rallies like this where everything looks too good (chart is self explanatory).


SEBI disclosure applicable

TATASTEEL triangle on monthly charts

This stock was a non performer in recent rallies. Now while it is trading at 52 week lows, it is also nearing support trendline on monthly charts.

Market outlook

- markets back to trading in a range
- advance decline flat
- support expected around 8200 levels (61.8% retracement)
- option writing support 8200 (next series) - this is a bullish sign.


NIFTY futures intraday charts

- rangebound trading day
- nothing to do
- note that break of day's high low (rectangle) led to mean reversion or back to box range
- for tomorrow, today's high / low and price behavior will be important.


July 27, 2015

LUMAXIND up 20%

You have to struggle to see the bar.

TIP: it is in the circle with O=H=L=C


SEBI disclosure applicable

JINDALSAW up 20%

Previous trend has been down this year. Let's see if we get a trend reversal.


SEBI disclosure applicable

Market outlook

- markets open gap down below 8500 decisively
- overall markets closed 2% in negative
- advance decline negative
- since markets closed below 8500, I will assume uptrend is over
- at the same time, I am unwilling to assume start of downtrend
- reason is markets are now back to trading in a range
- this means one should ignore these up down movements within the range
- option writing points to resistance at 8500-8600 levels.

NIFTY futures intraday charts

- markets open gap down below 8490 F
- charts show why this level is important
- short trade initialised; cover on close.

15 min chart:


Real estate correction has started... more cuts expected

Ambit Capital says

"We are seeing a broad-based real estate pullback, with prices correcting in most tier-1 and tier-2 cities alongside sharp drops in transaction and new launch volumes. The drivers for this slowdown are a mix of supply-side factors (banks have pulled back lending to developers) and demand-side factors (the Black Money Bill has created fear amongst speculators). The result is not just a drop in demand for building materials and challenges for lenders with big mortgage, LAP and housing finance books, but also a generalised slowdown in GDP growth, as the sector which drives 50% of India’s capex and 30% of its jobs conks off. Our four large-cap SELLs on this real estate correction are Ultratech, Asian Paints, ICICI and HUL."

"A broad-based real estate slowdown Whilst the RBI’s Housing Price Index suggests that prices have moderated on a pan-India basis, data from property websites suggests a deeper slowdown in India’s large cities, with prices falling by 7-18% YoY. Alongside this, we are also seeing a significant drop in transaction volumes: our visits to five property registration offices in Mumbai suggest a sharp drop in the registration of new residential properties and data from property valuers in Maharashtra and Tamilnadu suggest that transaction volumes have fallen by 10-15% per annum for three consecutive years now. Also, new launch volumes are down 40-80% on a pan-India level."

Read complete report at http://reports.ambitcapital.com/reports/Ambit_Economy_Thematic_RealEstate_14Jul2015.pdf


July 26, 2015

This Time Around, Entire Countries Will be Going Bust

For six years, the world has operated under a complete delusion that Central Banks somehow fixed the 2008 Crisis.

All of the arguments claiming this defied common sense. A 5th grader would tell you that you cannot solve a debt problem by issuing more debt. Similarly, anyone with a functioning brain could tell you that a bunch of academics with no real-world experience, none of whom have ever started a business or created a single job can’t “save” the economy.

Top Indian Companies Burdened With Debt

Debt levels at some of the top Indian companies, including those owned by billionaires Anil Ambani, Shashi & Ravi Ruia, Anil Agarwal and Savitri Jindal & family, have shot up in the past year while profits continue to be under pressure, according to a new report by Credit Suisse.

TITAN technicals

- trend is down on daily charts
- there is no buy signal
- but see the circled area

20 day swing indicator signals

Open positions

Best returns


Worst returns


For tension free investing, subscribe to our services. More info.

PVR breakout

Stock has recently given a breakout and is now retesting the breakout level.

Trade accordingly.

Caveat: low volume stock


SEBI disclosure applicable

INOX breakout

Stock has recently given a breakout and is now retesting the breakout level.

Trade accordingly.

Caveat: low volume stock


SEBI disclosure applicable

Syngene IPO: good for long term investors

Syngene International Ltd (SIL), a subsidiary of Biocon Ltd, is coming out with its maiden IPO via book building process offer for sale from existing stakeholders. It is offering 22000000 equity share of Rs. 10 each in a price band of Rs. 240-250 and thus mulls mobilizing Rs. 528-550 crore on at the basis of lower and upper price band.

Issue opens for subscription on 27.07.15 and will close on 29.07.15. Minimum application is to be made for 60 shares and in multiples thereon, thereafter.

July 24, 2015

Hot stocks and charts

LAST updated: 24-JUL-2015 
  • These charts are for educational purposes only.
  • This is not a recommendation to buy or sell
  • Follow the trend... if stock is above last month's high, trend is up and vice versa.
  • Golden stoploss: min 10% or last month's low (long position).
  • Never risk more than 1% of your capital on any trade.
  • All charts are provided by icharts.in
CUB
CUB chart

NIFTY this week

EOD charts:

- while trend is up, NF trading in a range this week
- swing low support is at 8500
- strong resistance 8700
- advance decline negative


NIFTY intraday futures charts

- initial bias was weak
- break of trading range was short trade (3rd arrow)
- cover at close
- aggressive short possible around 1st and 2nd arrow


Interesting world economy infographic

If itsy bitsy pie slice – Greece (.33%) – can create this much worldwide economic havoc because of their unpayble level of debt, imagine what will happen when the truth is revealed about France (3.81%), Italy (2.88%), and Spain (1.88%). China’s (13.9%) entire economic model has been built upon debt and the world consuming their output.

The world has run out of money to consume their shit. Japan (6.18%) is in the midst of a demographic and debt death spiral. The U.S. (23.32%) is living on borrowed time and the continued dominance of the USD. How long will it last? We are inhabiting in a world stacked with TNT run by monkeys with matches.


Source: http://www.zerohedge.com/news/2015-07-23/world-economy-visualized

China's Stock Market Pain Is India’s Financial Gain

The tumult in China’s stock markets has turned into a blessing for Indian shareholders.

International investors are pulling out of China, fueling record outflows through the Shanghai-Hong Kong exchange link, amid a $2.8 trillion plunge in mainland equity values since June 12. They’ve plowed $705 million into India over the same period, sparking a world-beating 7 percent gain in the benchmark S&P BSE Sensex index.
...

“The recent travails in China make India seem like an oasis of calm in terms of volatility,” Jonathan Schiessl, the head of equities at the U.K.-based Ashburton Investments, which oversees $12 billion, said in an e-mail. The fund has cut its exposure to China by 1 percent in the past month to invest in Indian equities and raise its cash position, he said.

Source: http://www.bloomberg.com/news/articles/2015-07-23/china-pain-is-india-s-gain-as-international-funds-flee-to-mumbai

July 23, 2015

Marc Faber: This Could Lead to a Stock Market Crash in 2015

The world could be on the verge of an economic collapse and investors should prepare for a stock market crash. At least, that’s according to renowned financial commentator Marc Faber.
During an interview on Wednesday, July 22th with CNBC, the publisher of The Gloom, Boom & Doom Report discussed the stock market crash. (Source: CNBC. July 22, 2015.)
“There were [also] more declining than advancing stocks and the list of 12-month new lows was very high on Friday.” Faber told the panel, “In the U.S., the market could easily drop 20% to 40%.”

Top gainers and trading opportunities

Figure out the trend, define a stoploss and trade long.

Risk per trade should be 1% of your trading capital

Hot stocks and charts

LAST updated: 23-JUL-2015 
  • These charts are for educational purposes only.
  • This is not a recommendation to buy or sell
  • Follow the trend... if stock is above last month's high, trend is up and vice versa.
  • Golden stoploss: min 10% or last month's low (long position).
  • Never risk more than 1% of your capital on any trade.
  • All charts are provided by icharts.in
ADITYA BIRLA NUVO
ADITYA BIRLA NUVO chart

Market outlook

- trend is up on daily charts
- swing reversal value is 8500
- today markets close 0.5% in red
- but advance decline was positive
- option writing points to support at 8500 and resistance at 8700.


NIFTY futures intraday charts

- last few days markets have been hitting resistance but unable to cross it
- today markets sold off  from resistance
- break of initial trading range was short signal
- did not trade short but looked for long opportunity
- did get a long trade but was breakeven
- markets were rangebound rest of the day/ nothing to do.


Hourly charts show rangebound nature of nifty


July 22, 2015

TATA CHEM breakout

Stock trading at lifetime highs


SEBI disclosure applicable

RELIANCE monthly charts

Strong resistance at 1150.

Stock reversed from this level in 2009, 2010 and 2014.


SEBI disclosure applicable

MCX mini breakout

HERO MOTORS technicals

On EOD charts, bullish above 2730. Support 2480.


SEBI disclosure applicable

BAJAJ AUTO technicals

- trend is up for past 2-3 months
- Immediate support 2430
- Lifetime high/ resistance 2700 levels


SEBI disclosure applicable

Market outlook

- trend is up on daily charts
- advance decline positive
- overall structure hints of a corrective rally
- this is because of 3 gap down openings followed by recovery
- now swing support at 8500
- option writing support at 8500


NIFTY futures intraday charts

- first bar was strongly bullish
- this also happened around 8500 levels which has strong put writing support
- breakout above first 15-20 range was buy signal
- cover at close


July 21, 2015

VEDL down 36% this year

Stock is down 36% this year.. but see the monthly charts


ONGC monthly charts

- trend is still down - no buying
- next support 240


SEBI disclosure applicable

KITEX big gap down

I think this is a good warning if you are long


SEBI disclosure applicable

So you like to buy the dips?

JINDALSTEL is down from 700 to 70s levels.

So you still like to buy the dips?

Moral: buy stocks making new highs, not new lows


SEBI disclosure applicable

INFY technicals

Today the stock gained 11% based on a news event (results/ guidance blah blah).

Now we will analyse stock on 2 timeframes

CAIRN still making lows

- All buy signals have failed
- obviously short side has worked
- stock declining from 380 levels.


SEBI disclosure applicable

BEML technicals

- stock at 5 year highs
- all time high is 1800 levels
- we are long from vertical line levels SL 1450


SEBI disclosure applicable

Market outlook

- trend is up on daily charts
- trend will reverse on close below 8300
- circle area shows warning; be cautious
- advance decline negative
- option writing support 8500 resistance 8700


NIFTY futures intraday charts

- initial bias was bearish as first 2 bars showed selling near last 2 day's high
- aggressive short possible here though not recommended
- break of second box was sell signal.
- notice 2 selloff bars within the second box
- cover at close.
- NOTE: this is hindsight analysis as I could not trade because of feed problems


July 20, 2015

BHARATFORG technicals

Stock bullish on close above 1150. SL 1000.


Monthly charts are bullish above 1000. Note stock has already rallied a lot.


SEBI disclosure applicable

ULTRACEMCO technicals

- stock on verge of breakout
- this will be on daily and monthly charts if it happens
- all is required is a nice close above 3400


SEBI disclosure applicable

DRREDDY breakout

- Stock closes at new lifetime high
- Breakout on daily and montly charts


SEBI disclosure applicable

Share this...