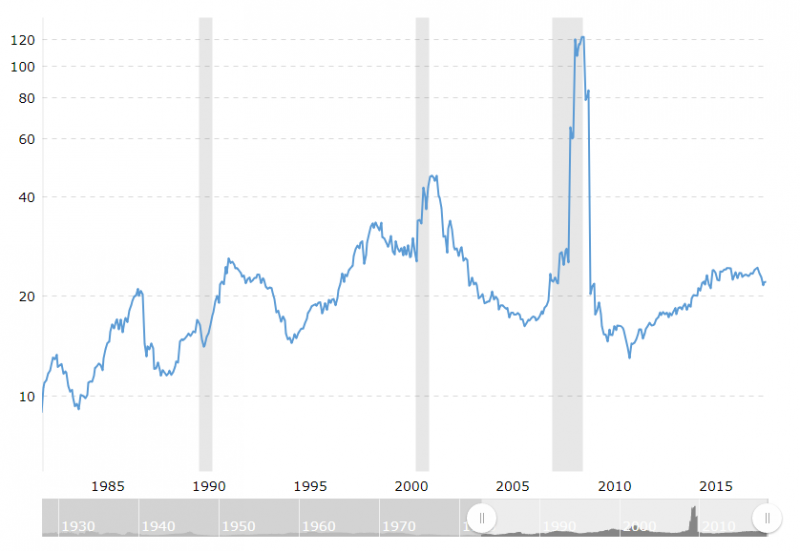
In 2008-2009, the S&P 500 PE ratio went from 20 to 120 and then back to 20... all this in 1 year.
What was the reason?
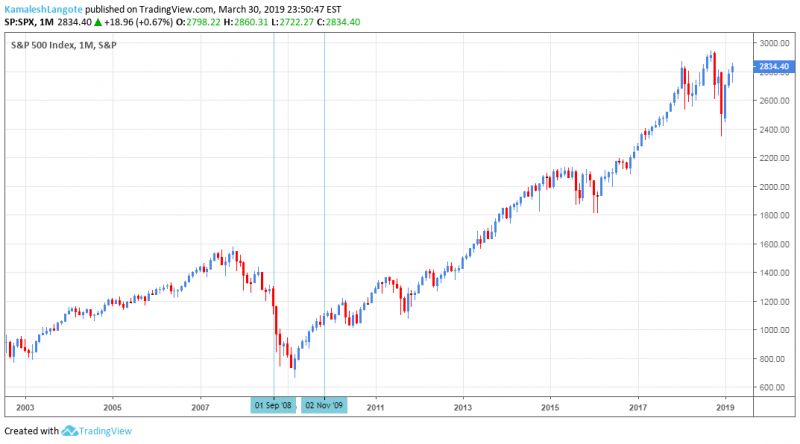
In the same time, the stock markets corrected marginally and were sideways for some time
This means the earnings dropped massively and the improved massively.
So what gives? Where is the catch?
Here is the explanation:
For PE to shoot up, the index has shoot or the earnings have to tank.
The period 2008-2009 was the peak of the financial crisis. During this period, banks wrote down their earnings massively. During those twelve months the banks were writing down all of the bad debt associated with the mortgage backed securities that has lost so much value. This meant that the banks were reporting negative earnings. Since the financial sector is a large part of the S&P500, this alone had an enormous effect on the index p/e. However, the problem was compounded by a general collapse in earnings across the economy as consumers reacted to the resulting uncertainty.
The same site reports earnings for the previous years at $17.11 for the S&P500, compared to $76.17 for the year prior to 2008. That is a collapse of about 78% in earnings. Although the S&P500 has suffered badly during this time, stock market investors being forward looking were starting to price in improved earnings by May 2009. Indeed, the S&P500 was up about 33% in just two months, from its low in March2009 to mid May2009. Thus, by May of 2009 prices were not suffering to the same extent as reported trailing earnings. This would account for the anomalous p/e value reporting in May2009.
Source: https://money.stackexchange.com/questions/73827/why-was-sp-500-pe-ratio-so-high-on-may-2009
What was the reason?
In the same time, the stock markets corrected marginally and were sideways for some time
This means the earnings dropped massively and the improved massively.
So what gives? Where is the catch?
Here is the explanation:
For PE to shoot up, the index has shoot or the earnings have to tank.
The period 2008-2009 was the peak of the financial crisis. During this period, banks wrote down their earnings massively. During those twelve months the banks were writing down all of the bad debt associated with the mortgage backed securities that has lost so much value. This meant that the banks were reporting negative earnings. Since the financial sector is a large part of the S&P500, this alone had an enormous effect on the index p/e. However, the problem was compounded by a general collapse in earnings across the economy as consumers reacted to the resulting uncertainty.
The same site reports earnings for the previous years at $17.11 for the S&P500, compared to $76.17 for the year prior to 2008. That is a collapse of about 78% in earnings. Although the S&P500 has suffered badly during this time, stock market investors being forward looking were starting to price in improved earnings by May 2009. Indeed, the S&P500 was up about 33% in just two months, from its low in March2009 to mid May2009. Thus, by May of 2009 prices were not suffering to the same extent as reported trailing earnings. This would account for the anomalous p/e value reporting in May2009.
Source: https://money.stackexchange.com/questions/73827/why-was-sp-500-pe-ratio-so-high-on-may-2009
No comments:
Post a Comment