- These charts are for educational purposes only.
- This is not a recommendation to buy or sell
- Follow the trend... if stock is at 20 days high, trend is up and vice versa.
- Golden stoploss: min 10% or 20 days low (long position).
- Never risk more than 1% of your capital on any trade.
- All charts are provided by icharts.in
December 11, 2014
Hot stocks and charts

Markets close below 8300
My trend reversal level for nifty was 8300 spot and today markets closed below this level. Now I have to assume trend is down till nifty closes above 8630 spot.
I expect good support at 8160 spot levels.
Note that hourly charts gave a sell on close below 8500 and this is the level a futures trader should be looking at.
A word about 8300... there is nothing magical or sacrosanct about this level. Normally I take recent swing low as reversal level. In this case, the swing low was at 7700 and nothing above that till 8630. Since we need some SL I settled on 8300 as we had a cluster of supports here. So this 8300 is more of a support area and not a swing low level. Also, it does not matter in this case if the support is at 8280 or 8310.
If the trend has to turn down, whatever level you plot (eg. 8200 or 8400) has to eventually break... it may happen few days earlier or later.
I expect good support at 8160 spot levels.
Note that hourly charts gave a sell on close below 8500 and this is the level a futures trader should be looking at.
A word about 8300... there is nothing magical or sacrosanct about this level. Normally I take recent swing low as reversal level. In this case, the swing low was at 7700 and nothing above that till 8630. Since we need some SL I settled on 8300 as we had a cluster of supports here. So this 8300 is more of a support area and not a swing low level. Also, it does not matter in this case if the support is at 8280 or 8310.
If the trend has to turn down, whatever level you plot (eg. 8200 or 8400) has to eventually break... it may happen few days earlier or later.
December 10, 2014
Hot stocks and charts
- These charts are for educational purposes only.
- This is not a recommendation to buy or sell
- Follow the trend... if stock is at 20 days high, trend is up and vice versa.
- Golden stoploss: min 10% or 20 days low (long position).
- Never risk more than 1% of your capital on any trade.
- All charts are provided by icharts.in
Market outlook
Short term trend (hourly charts) is down ... EOD trend is still up and reverse on close below 8300 spot.
My swing indicator SL is 8300 (20 days low).
Those who like to focus on MA should note that 50DMA is 8210 spot.... this level is NOV month low.
Option writing is giving mixed clues... writers expect 8300 to break but they are not expecting a big fall. They also do not expect markets to cross 8600 in immediate future.
My swing indicator SL is 8300 (20 days low).
Those who like to focus on MA should note that 50DMA is 8210 spot.... this level is NOV month low.
Option writing is giving mixed clues... writers expect 8300 to break but they are not expecting a big fall. They also do not expect markets to cross 8600 in immediate future.
December 9, 2014
Hot stocks and charts
- These charts are for educational purposes only.
- This is not a recommendation to buy or sell
- Follow the trend... if stock is at 20 days high, trend is up and vice versa.
- Golden stoploss: min 10% or 20 days low (long position).
- Never risk more than 1% of your capital on any trade.
- All charts are provided by icharts.in
Market outlook
Faster retracement of rally hints at a bigger correction. While support at 8300 is not violated, the extent of fall in 2 days in comparison with the number of days required to rally means we are looking at a trend reversal.
Note that hourly charts gave a sell yesterday and 15 min charts gave a sell from 1-DEC.
Note that hourly charts gave a sell yesterday and 15 min charts gave a sell from 1-DEC.
December 8, 2014
Market outlook
Trend is up and will reverse on close below 8300.
Now last week's low was 8500 and a good support and today (first day of the week), markets sold off and closed below this support. So depending on your trading style, you may assume that trend has already reversed. If this is the case, then fine... your buy above level would be last week's high at
8630 spot (roughly).
Hourly charts have a clear sell...
Now last week's low was 8500 and a good support and today (first day of the week), markets sold off and closed below this support. So depending on your trading style, you may assume that trend has already reversed. If this is the case, then fine... your buy above level would be last week's high at
8630 spot (roughly).
Hourly charts have a clear sell...
December 7, 2014
CNX IT technicals
Current uptrend is weakening and the index has closed below the recent swing high / resistance at 11600.
The index also suffered its largest one day fall in past 20-30 days.
The index also suffered its largest one day fall in past 20-30 days.
December 6, 2014

December 5, 2014
BANK NIFTY technicals
BNF still trending up nicely.... no signs of any weakness.
Immediate support 17800.

Immediate support 17800.
Weekend update
Trend is up and will reverse on close below 8300.
I am also looking at trendline support as shown on the chart.
Option writing shows increasing support at 8500 and diminishing resistance at 8700 levels... this is a
bullish sign.
India VIX is almost at record lows... not a good sign as it indicates lack of any fear in markets.
I am also looking at trendline support as shown on the chart.
Option writing shows increasing support at 8500 and diminishing resistance at 8700 levels... this is a
bullish sign.
India VIX is almost at record lows... not a good sign as it indicates lack of any fear in markets.
December 4, 2014
VOLTAMP breakout
VOLTAMP breakout... note that this is a low volume stock but I like the chart as an example of how a breakout should look.
The breakout level is 740 and since this level offered resistance in the past, it should now offer support.
Your SL will be below this level.
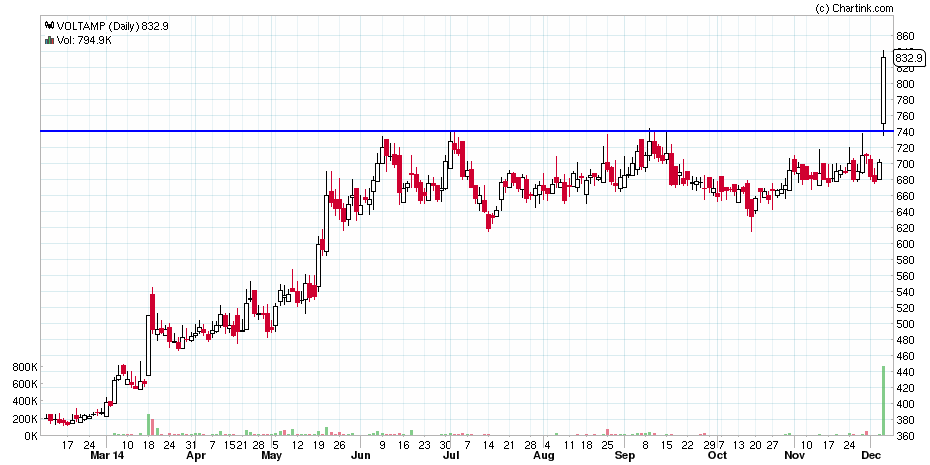
The breakout level is 740 and since this level offered resistance in the past, it should now offer support.
Your SL will be below this level.
Breakout in NIFTY JUNIOR index
NIFTY JUNIOR index has given another breakout... now this index (trending up) will reverse on close below 18200.

Market outlook
Trend is up and will reverse on close below 8300.
Signs of increasing volatility in the region between 8500 and 8650 spot.
I am also looking at trendline support as shown on the chart.
Option writing shows increasing support at 8500 and diminishing resistance at 8700 levels... this is a bullish sign.
Signs of increasing volatility in the region between 8500 and 8650 spot.
I am also looking at trendline support as shown on the chart.
Option writing shows increasing support at 8500 and diminishing resistance at 8700 levels... this is a bullish sign.
December 3, 2014
Market outlook
Trend is up and will reverse on close below 8300.
Today markets traded in a range and failed to give any directional breakout. Ideally it should have crossed yesterday's highs but since it has not, one should start becoming cautious.
Today markets traded in a range and failed to give any directional breakout. Ideally it should have crossed yesterday's highs but since it has not, one should start becoming cautious.
JETAIRWAYS breakout
Stock has given a strong breakout... the fundamental explanation is the rather substantial drop in crude prices which will substantially benefit an airline company as fuel accounts for large cost of its operations.
See the breakout ... 40% gain in less than 2 weeks.
See the breakout ... 40% gain in less than 2 weeks.
December 2, 2014
BANK NIFTY technicals
Breakout above 16200 is still strong with only a minor correction in between.
Consider trend as up with swing low support at 17800.

Consider trend as up with swing low support at 17800.
Market outlook
Trend is up and will reverse on close below 8300.
Today, markets closed in the red for the 2nd consecutive day. Within an uptrend, lower high lower low formation is allowable for 2-3 days after which prior trend must resume.
The nature of the fall looks like a correction and not a trend reversal. For a trend reversal, I will look at a faster retracement of the previous rally and so far this is elluding us.
Option writing is giving mixed clues... resistance at 8700 and support at 8500.
Today, markets closed in the red for the 2nd consecutive day. Within an uptrend, lower high lower low formation is allowable for 2-3 days after which prior trend must resume.
The nature of the fall looks like a correction and not a trend reversal. For a trend reversal, I will look at a faster retracement of the previous rally and so far this is elluding us.
Option writing is giving mixed clues... resistance at 8700 and support at 8500.
Small Cap index chart
This is a 2 year weekly chart... after giving a buy signal around 3400 levels. the index is now consolidating and trading in a range. Note that while is still making new highs, this index has not crossed JULY highs and is in fact correcting.
Support 4800... further bullishness above 5400 levels.
.png)
Support 4800... further bullishness above 5400 levels.
Option writing clues
Option writing points to support at 8500 and resistance at 8700. This is as per yesterday's data.
Let's see how markets behave at these levels.

Let's see how markets behave at these levels.
Subscribe to:
Posts (Atom)