
March 31, 2020

NIFTY monthly charts
- trend is down
- monthly close is below prev support at 10000 and swing high at 9000 (2015)
- long term trendline broken
- next support 6400
- 61.8% retracement from 2016 low to 2020 high done around 9000 levels
- 61.8% retracement from 2008 lows to 2020 high is around 6000 levels

- monthly close is below prev support at 10000 and swing high at 9000 (2015)
- long term trendline broken
- next support 6400
- 61.8% retracement from 2016 low to 2020 high done around 9000 levels
- 61.8% retracement from 2008 lows to 2020 high is around 6000 levels

Market outlook
Daily charts:
- trend is down on daily charts
- today nifty closed 4% in positive at 8598
- AD was 13:5
- VIX down 10% now at 64
- resistance 9000
- above this, shorts may become nervous
- 14 day ATR is 500+
- trend is down on daily charts
- today nifty closed 4% in positive at 8598
- AD was 13:5
- VIX down 10% now at 64
- resistance 9000
- above this, shorts may become nervous
- 14 day ATR is 500+

Major bear move has started?
Hourly charts again with today's data. #Nifty_fut— Subhadip Nandy (@SubhadipNandy) March 30, 2020
Major bear move has started. The yellow highlight at the bottom signifies a major move about to take place#quantitative #proprietary pic.twitter.com/35PkbC3o1X
March 30, 2020
NIFTY fell 380 points overnight... yet positional put option buyers hardly made money
- despite a 380 point fall in the nifty, put prices did not appreciate
- was this because of theta? there was no change in VIX
- note I am writing about weekly expiry options
- someone who bought 8700 PE on Friday close has earned 77 points after a 380 point fall
- and a 8300 PE has actually lost money
- let us see what happens tomorrow
Summary: do not trade options unless you know the greeks
Newbies: visit http://zerodha.com/varsity/module/option-theory/

- was this because of theta? there was no change in VIX
- note I am writing about weekly expiry options
- someone who bought 8700 PE on Friday close has earned 77 points after a 380 point fall
- and a 8300 PE has actually lost money
- let us see what happens tomorrow
Summary: do not trade options unless you know the greeks
Newbies: visit http://zerodha.com/varsity/module/option-theory/
Market outlook
Daily charts:
- trend is down on daily charts
- today nifty closed 45 in negative at 8281
- AD was 7:11
- 3 days pattern of higher high higher low got disrupted today
- there was a warning on Friday anyway
- nice swing high formed around 9000
- support 7500
- trend is down on daily charts
- today nifty closed 45 in negative at 8281
- AD was 7:11
- 3 days pattern of higher high higher low got disrupted today
- there was a warning on Friday anyway
- nice swing high formed around 9000
- support 7500
March 29, 2020
Bob Farrell's 10 Rules
Bob Farrell is a Wall Street veteran who draws on some 50 years of experience in crafting his investing rules. After finishing a masters program at Columbia Business School, he launched his career as a technical analyst with Merrill Lynch in 1957. Even though Mr. Farrell studied fundamental analysis, he turned to technical analysis after realizing there was more to stock prices than balance sheets and income statements. He became a pioneer in sentiment studies and market psychology. His 10 rules on investing stem from personal decades of experience with dull markets, bull markets, bear markets, crashes, and bubbles. In short, Bob Farrell has seen it all and lived to tell about it.
Like all rules on Wall Street, Bob Farrell's 10 rules are not intended to be considered hard and fast or set in stone. There are exceptions to every rule. Nevertheless, these rules will benefit you as a trader or as an investor by helping you to look beyond the latest news headlines or your gut emotions. Being aware of sentiment can prevent traders from selling near the bottom and buying near the top, which often goes against our natural instincts. Human nature causes individual investors and traders to often feel most confident at the top of a market. At the same time, they often feel most pessimistic or cautious at market bottoms. Awareness of these emotions and their potential consequences is the first step towards conquering their adverse effects.
Read more at https://school.stockcharts.com/doku.php?id=overview:bob_farrell_10_rules
Like all rules on Wall Street, Bob Farrell's 10 rules are not intended to be considered hard and fast or set in stone. There are exceptions to every rule. Nevertheless, these rules will benefit you as a trader or as an investor by helping you to look beyond the latest news headlines or your gut emotions. Being aware of sentiment can prevent traders from selling near the bottom and buying near the top, which often goes against our natural instincts. Human nature causes individual investors and traders to often feel most confident at the top of a market. At the same time, they often feel most pessimistic or cautious at market bottoms. Awareness of these emotions and their potential consequences is the first step towards conquering their adverse effects.
Read more at https://school.stockcharts.com/doku.php?id=overview:bob_farrell_10_rules
NIFTY weekly charts
- trend is down
- 5th consecutive week of lower high lower low
- resistance around 9000... 10000 is the bigger one
- no relief rally as yet
- ATR(14) around 700 (daily is 500+)

- 5th consecutive week of lower high lower low
- resistance around 9000... 10000 is the bigger one
- no relief rally as yet
- ATR(14) around 700 (daily is 500+)

BANKNIFTY weekly charts
- trend is down
- this week is the 5th lower high lower low formation
- not once has the index closed above prev week highs
- any pullback is likely to get resisted around 24000 levels
- ATR(14) is 2200 or approx 11%

- this week is the 5th lower high lower low formation
- not once has the index closed above prev week highs
- any pullback is likely to get resisted around 24000 levels
- ATR(14) is 2200 or approx 11%

March 28, 2020
Hypothetical question
If you see a 200-foot high tsunami heading toward you on the beach, would you conclude that it is a hoax because you are still dry?
Discuss. By Scott Adams
Discuss. By Scott Adams

If you are alive 60 days from now, you will regret losing the equity opportunity of March 2020, says Basant Maheshwari
“The game right now is to wait for clarity, but as we have seen in the past, if you are waiting for clarity, then you will have to pay the price of clarity. People who stayed in cash in 2008 didn’t buy till the Sensex had doubled itself in 2009,” he said.
That bull run saw the emergence of multibaggers like Page Industries and Pantaloon, which surged up to 40 times in the next few years.
“In 60 days from now if we are alive, then we will regret the opportunity of March 2020. If ..
Read more at:
https://economictimes.indiatimes.com/markets/stocks/news/if-you-are-alive-60-days-from-now-we-will-regret-losing-the-equity-opportunity-of-march-2020-says-basant-maheshwari/articleshow/74824500.cms
That bull run saw the emergence of multibaggers like Page Industries and Pantaloon, which surged up to 40 times in the next few years.
“In 60 days from now if we are alive, then we will regret the opportunity of March 2020. If ..
Read more at:
https://economictimes.indiatimes.com/markets/stocks/news/if-you-are-alive-60-days-from-now-we-will-regret-losing-the-equity-opportunity-of-march-2020-says-basant-maheshwari/articleshow/74824500.cms
March 27, 2020
Market outlook
Daily charts:
- trend is down on daily charts
- today nifty closed flat at 8660
- AD was 5:4
- this was 3rd consecutive day of higher high higher low
- nifty opened gap up but could not sustain at highs
- now we have various possibilities
- retest of recent lows and then breakout above 9000
- break of recent lows
- rangebound market
- trend is down on daily charts
- today nifty closed flat at 8660
- AD was 5:4
- this was 3rd consecutive day of higher high higher low
- nifty opened gap up but could not sustain at highs
- now we have various possibilities
- retest of recent lows and then breakout above 9000
- break of recent lows
- rangebound market
March 26, 2020
Market outlook
Daily charts:
- trend is down on daily charts
- today nifty closed 4% at 8641
- AD was 13:5
- VIX dropped 8% to 71
- I think we are seeing bear market rally or technical pullback
- this will not be a time to start investing (except SIP in mutual funds)
- resistance 10000
- trend is down on daily charts
- today nifty closed 4% at 8641
- AD was 13:5
- VIX dropped 8% to 71
- I think we are seeing bear market rally or technical pullback
- this will not be a time to start investing (except SIP in mutual funds)
- resistance 10000
Stocks which have corrected the least in 30 days
NIFTY 50

NIFTY Next 50

- buy strength not weakness
- buy when stock makes a 52 week
- risk per trade under 1%
- define SL before taking position

NIFTY Next 50

- buy strength not weakness
- buy when stock makes a 52 week
- risk per trade under 1%
- define SL before taking position
March 25, 2020
Market outlook
Daily charts:
- trend is down on daily charts
- today nifty closed 7% in positive at 8318
- AD was 11:7
- VIX down 8%
- 14 day ATR is 535
- swing highs (very approx) is at 9000, 10000
- no technical pullback/ relief rally seen in this correction so far
- the first buy signal will fail.
- trend is down on daily charts
- today nifty closed 7% in positive at 8318
- AD was 11:7
- VIX down 8%
- 14 day ATR is 535
- swing highs (very approx) is at 9000, 10000
- no technical pullback/ relief rally seen in this correction so far
- the first buy signal will fail.
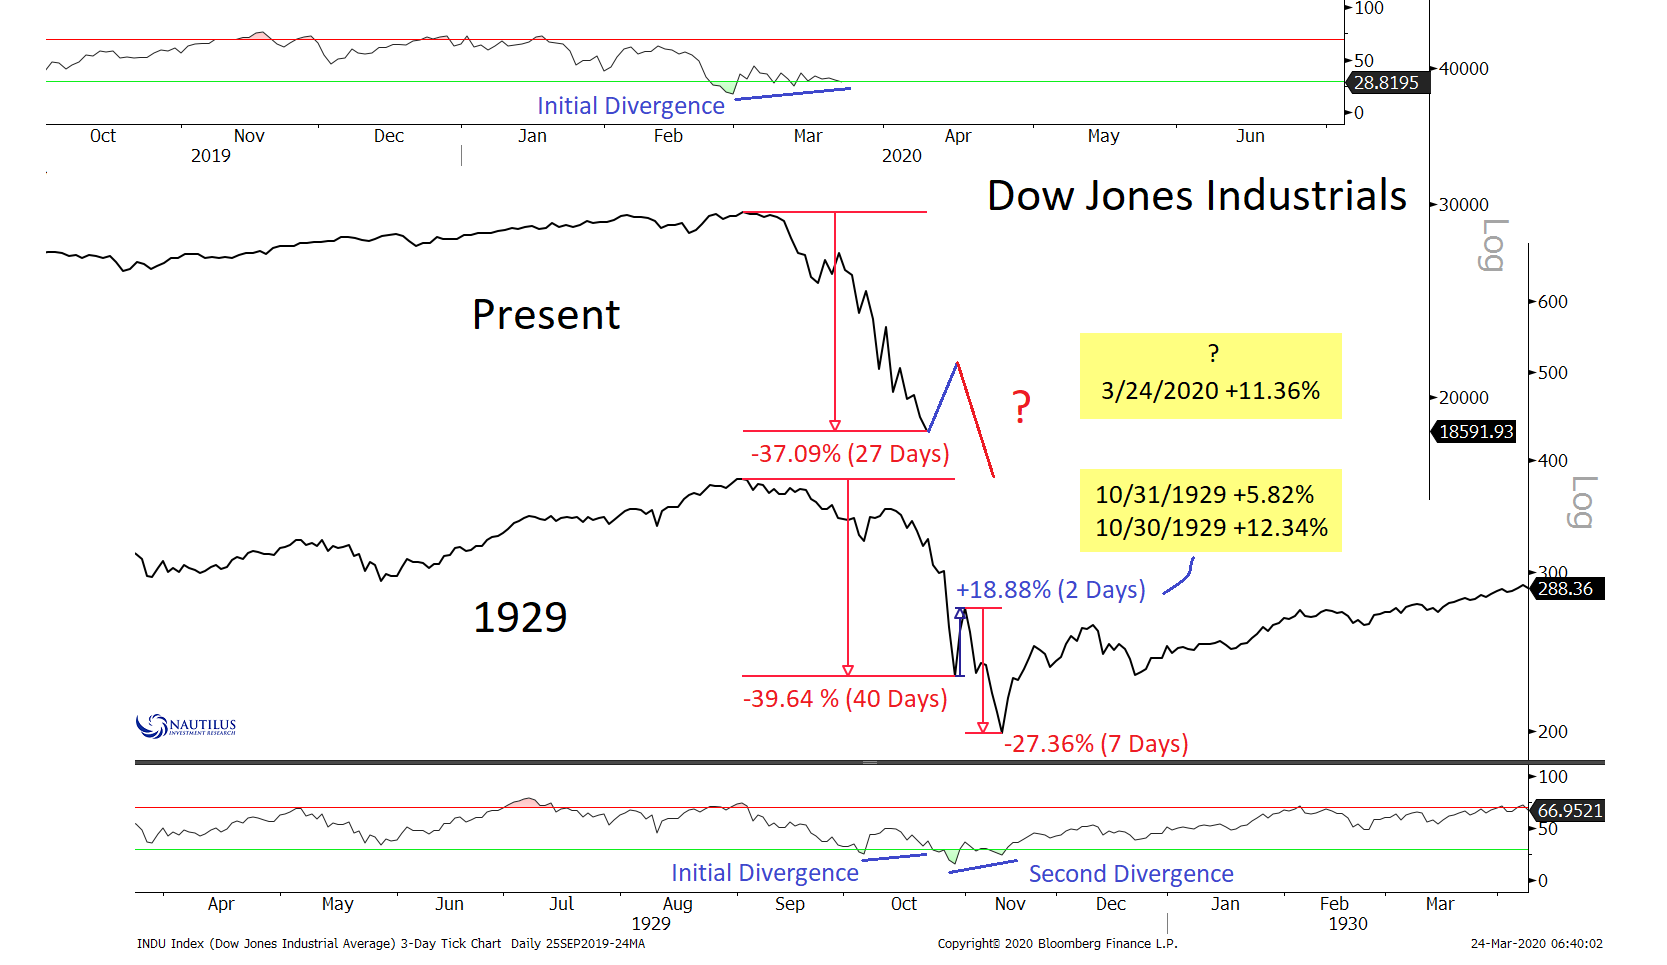
March 24, 2020
Market outlook
Daily charts:
- trend is down on daily charts
- today nifty closed 2.5% in positive at 7801
- AD was 4:5
- VIX jumps 14% to 82
- intraday high was 86
- evidence of bottoming out would be huge drop in VIX
- as of now this is not happening
- trend is down on daily charts
- today nifty closed 2.5% in positive at 7801
- AD was 4:5
- VIX jumps 14% to 82
- intraday high was 86
- evidence of bottoming out would be huge drop in VIX
- as of now this is not happening
NIFTY PE and PB ratio in 2008
The current PE is 17 and PB ratio is 2.17
Feel free to draw your own interpretations

Feel free to draw your own interpretations
Subscribe to:
Posts (Atom)