Very often similar candlestick patterns or formation have completely different implications. The keyword here is "context". So a pattern which is bullish in one context can be bearish in another context.
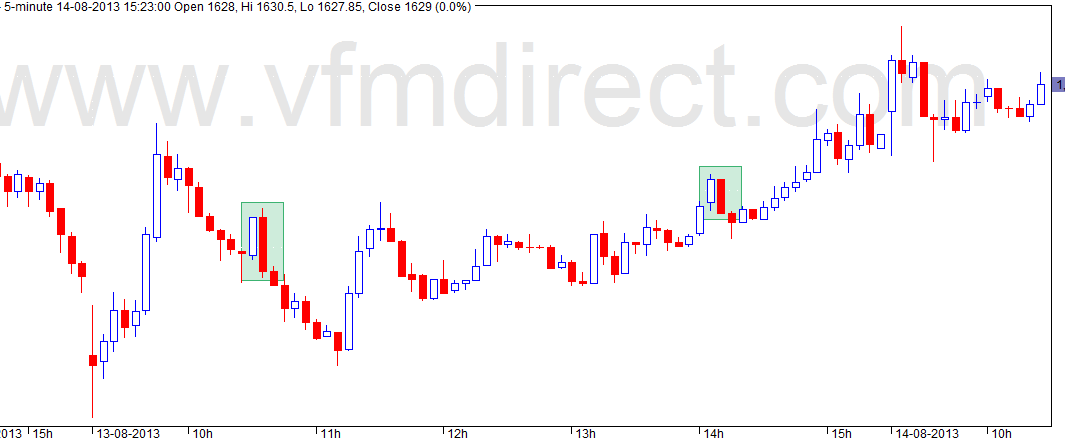
Take the following intraday chart...

The colored rectangles refer one large UP bar followed by a DOWN bar.
If you refer the context in which this has happened, the first is in downtrend where there is a high possibility of any bullish signal failing (longs getting trapped). The second instance has a sell signal but the shorts are now getting trapped.
Summary: always pay attention to the context in which a pattern or formation occurs. What is a signal for one set of traders becomes a contrarian call for smart money.
Take the following intraday chart...
The colored rectangles refer one large UP bar followed by a DOWN bar.
If you refer the context in which this has happened, the first is in downtrend where there is a high possibility of any bullish signal failing (longs getting trapped). The second instance has a sell signal but the shorts are now getting trapped.
Summary: always pay attention to the context in which a pattern or formation occurs. What is a signal for one set of traders becomes a contrarian call for smart money.
ha ha ha :) soooooooo smart and experienced. charts can;t cheat you as it is doing for others
ReplyDeletehv a great week.
regds