I rarely see RSI but today I saw out of curiosity and voila... we have negative divergence on daily charts.
The reason I don't see this is when you are in markets long enough the price behaviour will start hinting at some reversal. You can actually sense some distribution happening.
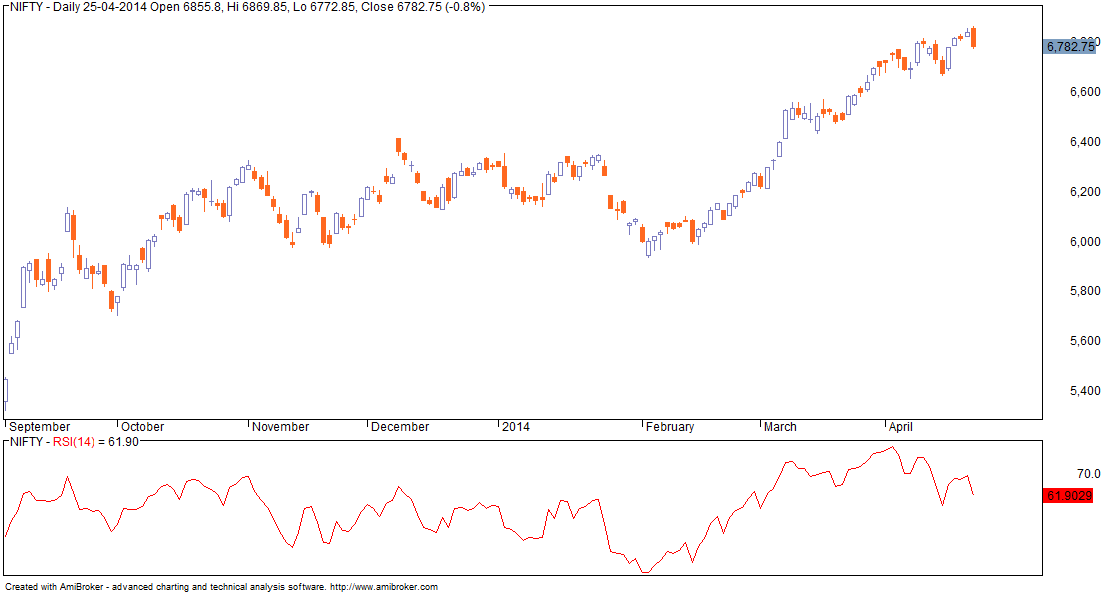
On weekly charts, RSI seems to be near record high levels... this is an important clue I missed. While theoretically there is no rule which says RSI cannot go higher, the historical evidence says topping out is nearby.

The reason I don't see this is when you are in markets long enough the price behaviour will start hinting at some reversal. You can actually sense some distribution happening.
On weekly charts, RSI seems to be near record high levels... this is an important clue I missed. While theoretically there is no rule which says RSI cannot go higher, the historical evidence says topping out is nearby.
No comments:
Post a Comment