Candlesticks is a Japanese trading technique invented in the 18th century by rice traders.
Today this technique is called candlestick charting and is widely used when drawing stock charts.
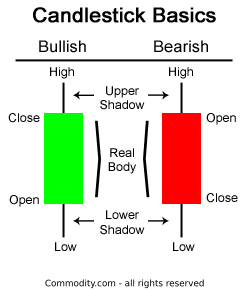
Candlestick charts use the same price data as bar charts (open, high, low, close). However, candlestick charts are drawn in a much more visually identifiable way typically resembling a candle with wicks on both ends. The high and low are described as shadows and plotted as a single line.
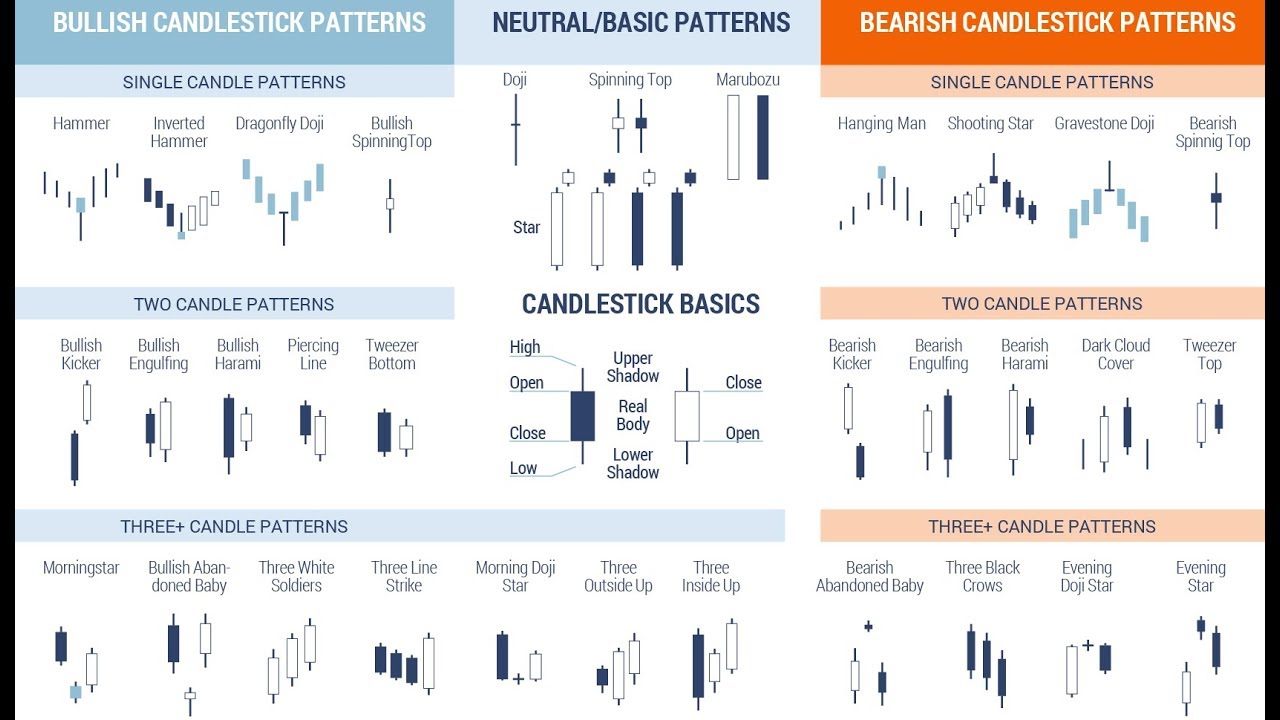
About patterns
Candlesticks form interesting patterns which give excellent clues above market trend and direction. Patterns are independent of time frame and can even clubbed!
I have listed my favourites patterns here. These are reliable and the reliability increases dramatically if the previous move is strong. |
No comments:
Post a Comment