I use (mostly) 15 min charts for option writing.
NF gave a sell signal on 12-DEC around 8230 F. Today NF is at 8100 giving a profit of 130 points.

You could have bought a put (since the trend is down). You could have bought 8100 put around 60. But even after a 130 point fall, the put is trading around 50 meaning a loss.

You could have bought 8000 put around 40... this is now trading at 20!

In effect, both trades are loss making inspite of "following the trend"... the reason for the loss is time decay and drop in implied volatility... this is something the option buyer has no control but this works in favour of the option writer.
When does the option buyer make money? Only if there is a big move. This is rare as most markets spend more time trading sideways instead of trending.
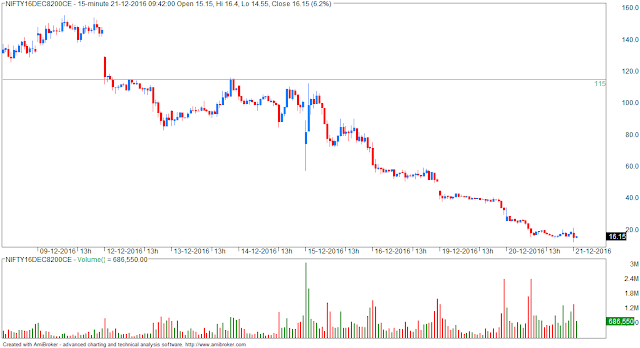
Let us assume that instead of buying a put, you have written 8200 call around 115... the same is now trading at 20 giving excellent profits.
NOTE: one should ideally be writing 8300 call as it is out of money but for purpose of this example the 8200 call chart should suffice.
Hope this helps.
NF gave a sell signal on 12-DEC around 8230 F. Today NF is at 8100 giving a profit of 130 points.

You could have bought a put (since the trend is down). You could have bought 8100 put around 60. But even after a 130 point fall, the put is trading around 50 meaning a loss.

You could have bought 8000 put around 40... this is now trading at 20!

In effect, both trades are loss making inspite of "following the trend"... the reason for the loss is time decay and drop in implied volatility... this is something the option buyer has no control but this works in favour of the option writer.
When does the option buyer make money? Only if there is a big move. This is rare as most markets spend more time trading sideways instead of trending.
Let us assume that instead of buying a put, you have written 8200 call around 115... the same is now trading at 20 giving excellent profits.
NOTE: one should ideally be writing 8300 call as it is out of money but for purpose of this example the 8200 call chart should suffice.

Hope this helps.