Reading lots of interesting / divergent views on this topic with no explanations being offered on how to identify if something is oversold or overbought.
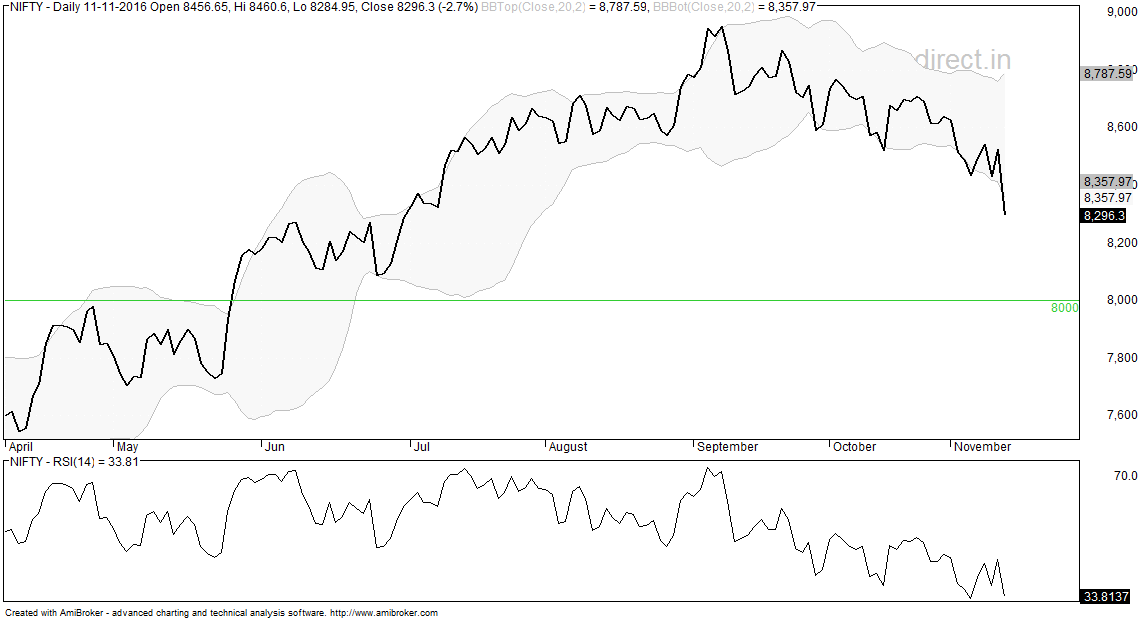
Here is the chart with RSI set at 14... note this is a line chart which considers only the closing.

NF is certainly looking weak on 14 day RSI chart but is near double bottom support. The RSI value is 34 but for oversold reading it should go down to 20.
Note that in strong corrections, a stock or index can remain oversold for extended periods of time (and vice versa).
Summary: trend is down since mid SEP (line chart) ... reversal level is close above 8600.
Disclaimer: I do not use these indicators.... this post is to clarify questions I receive via email.
Here is the chart with RSI set at 14... note this is a line chart which considers only the closing.
NF is certainly looking weak on 14 day RSI chart but is near double bottom support. The RSI value is 34 but for oversold reading it should go down to 20.
Note that in strong corrections, a stock or index can remain oversold for extended periods of time (and vice versa).
Summary: trend is down since mid SEP (line chart) ... reversal level is close above 8600.
Disclaimer: I do not use these indicators.... this post is to clarify questions I receive via email.
No comments:
Post a Comment