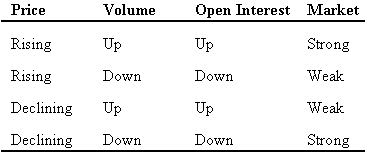
So, price action increasing in an uptrend and open interest on the rise is interpreted as new money coming into the market (reflecting new buyers); this is considered bullish. Now, if the price action is rising and the open interest is on the decline, short sellers covering their positions are causing the rally. Money is therefore leaving the marketplace; this is a bearish sign.
If prices are in a downtrend and open interest is on the rise, chartists know that new money is coming into the market, showing aggressive new short selling. This scenario will prove out a continuation of a downtrend and a bearish condition. Lastly, if the total open interest is falling off and prices are declining, the price decline is likely being caused by disgruntled long position holders being forced to liquidate their positions. Technicians view this scenario as a strong position technically because the downtrend will end once all the sellers have sold their positions.

Read more at https://www.investopedia.com/articles/technical/02/112002.asp
This can also be explained as:
If prices are in a downtrend and open interest is on the rise, chartists know that new money is coming into the market, showing aggressive new short selling. This scenario will prove out a continuation of a downtrend and a bearish condition. Lastly, if the total open interest is falling off and prices are declining, the price decline is likely being caused by disgruntled long position holders being forced to liquidate their positions. Technicians view this scenario as a strong position technically because the downtrend will end once all the sellers have sold their positions.

Read more at https://www.investopedia.com/articles/technical/02/112002.asp
This can also be explained as:
| Price | OI | Position |
| UP | UP | Long |
| Down | UP | Short |
| UP | Down | Short Covering |
| Down | Down | Long Unwinding |
No comments:
Post a Comment